Image Processing Reference
In-Depth Information
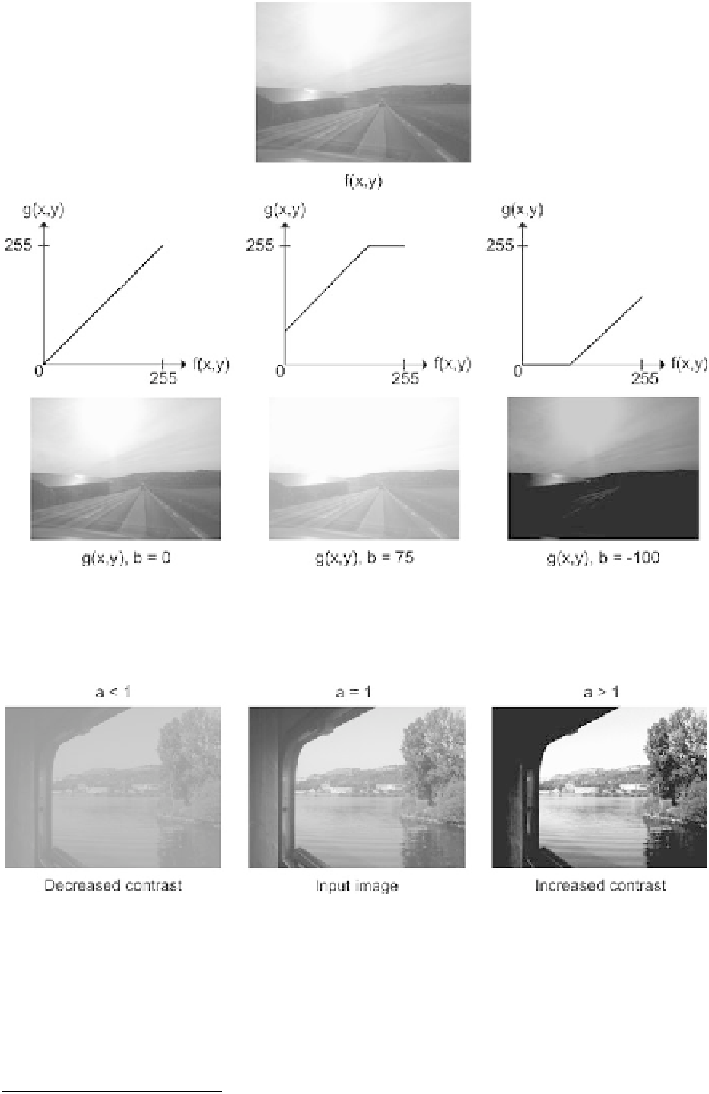
Fig. 4.3
Three examples of gray-level mapping. The top image is the input. The three other images
are the result of applying the three gray-level mappings to the input. All three gray-level mappings
are based on Eq.
4.1
Fig. 4.4
If
a
in Eq.
4.2
is one, the resulting image will be equal to the input image. If
a
is smaller
than one then the resulting image will have decreased contrast, and if
a
is higher than one then the
resulting image will have increased contrast
them and we will say the contrast is
high
. The contrast of an image is changed by
changing the slope of the graph
1
:
1
In practice the line is not rotated around
(
0
,
0
)
but rather around the center point
(
127
,
127
)
, hence
b
=
−
a)
. However, for the discussion here it suffice to say that
b
=
127
(
1
0 and only look at the
slope.