Environmental Engineering Reference
In-Depth Information
σ
1
σ
2
>
σ
1
σ
2
a
1
d
()
d
a
d
()
d
a
,
σ
2
a
2
a
1
,
σ
2
a
0
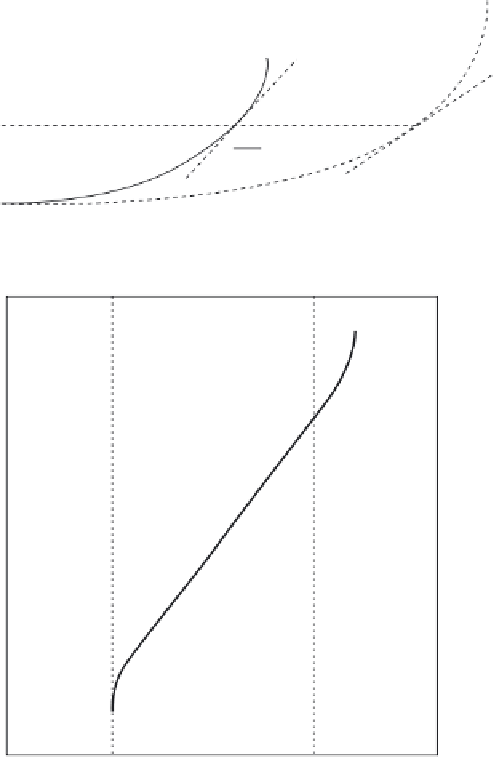
Cycles, N
Region I
Region II
Region III
Stress intensity factor range,
Δ
K
(in log scale)
1. 8
(a) Crack extension with number of cycles and (b) log-log plot of
d
a
/d
N
vs Δ
K
.
In Equation [1.14],
Y
is the geometric factor which is a function of
a
/
w
(
a
is crack length and
w
is specimen width).
Stage I corresponds to formation of a fi ne crack from surface defects (such
as scratches, key ways, stress concentrations) with slow initial propagation
along specifi c crystallographic directions covering few grains before the
growth enters stage II where the crack propagates at a relatively faster rate
and on a plane perpendicular to the loading direction. In general, persistent
slip bands (PSBs), beach marks and fatigue striations (Fig. 1.9a and 1.9b)

Search WWH ::

Custom Search