Geoscience Reference
In-Depth Information
h [m]
h [m]
'
= 46° N
'
= 45° N
2000
2000
¸
= 09° E
¸
= 03° E
1500
1500
1000
1000
500
500
®
g [mgal]
g [mgal]
0
0
-150
-100
-50
0
+50
-50
0
+50
+100
+150
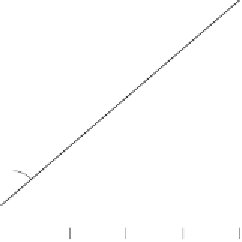
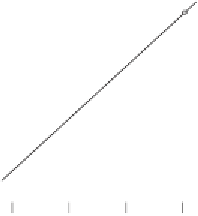
Fig. 9.4. Correlation of the free-air anomalies with height
which is important in many cases. Therefore our formulas were valid only
for gravity anomalies uncorrelated with height, such as isostatic or, to a
certain extent, Bouguer anomalies; or for free-air anomalies in moderately
flat areas. Free-air anomalies in mountains must be treated differently.
Figure 9.4 due to U.A. Uotila shows the correlation of free-air anomalies
with height. The gravity anomalies ∆
g
are plotted against the height
h
.If
there were an exact functional dependence between ∆
g
and
h
, then all points
would lie on a straight line (or, more generally, on a curve). In reality, there
is only an approximate functional relation, a general trend or tendency of
the free-air anomalies to increase linearly with height; exceptions, even large
ones, are possible. This shows very well the meaning of correlation.
We have characterized the mutual correlation of the gravity anomalies
by the “autocovariance function” (9-6),
∆
g
∆
g
}
C
(
s
)=
M
{
,
(9-75)
where
s
=
PP
. Similarly, we may form the “cross-covariance function”
∆
g
∆
h
}
∆
g
∆
h
B
(
s
)=
M
{
=
M
{
}
,
(9-76)
expressing the correlation between gravity and height, and
∆
h
∆
h
}
A
(
s
)=
M
{
,
(9-77)
which is the autocovariance function of the height differences
∆
h
=
h
−
M
{
h
}
,
(9-78)