Information Technology Reference
In-Depth Information
C
C
Tissue Cells
Tissue Cells
V
V
Viruses
Viruses
infectious
infectious
60
60
25
25
50
50
20
20
40
40
15
15
30
30
10
10
20
20
5
5
10
10
250
t
250
t
250
t
250
t
50
50
100
100
150
150
200
200
50
50
100
100
150
150
200
200
D
D
Dendritic Cells
Dendritic Cells
Ag
Ag
Antigens
Antigens
10
10
50
50
8
8
40
40
6
6
30
30
4
4
20
20
2
2
10
10
250
t
250
t
250
t
250
t
50
50
100
100
150
150
200
200
50
50
100
100
150
150
200
200
H
H
Helper T
Helper T
Cells
Cells
Ab
Ab
Antibodies
Antibodies
300
300
15
15
250
250
12.5
12.5
200
200
10
10
150
150
7.5
7.5
100
100
5
5
50
50
2.5
2.5
250
t
250
t
250
t
250
t
50
50
100
100
150
150
200
200
50
50
100
100
150
150
200
200
KT
KT
Killer T
Killer T
Cells
Cells
M
M
Macrophages
Macrophages
25
25
15
15
12.5
12.5
20
20
10
10
15
15
7.5
7.5
10
10
5
5
5
5
2.5
2.5
250
t
250
t
250
t
250
t
50
50
100
100
150
150
200
200
50
50
100
100
150
150
200
200
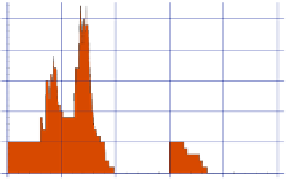
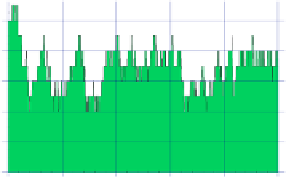
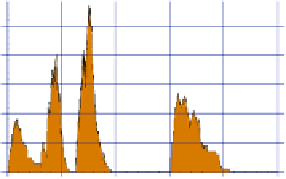
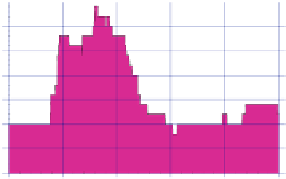
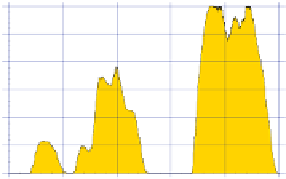
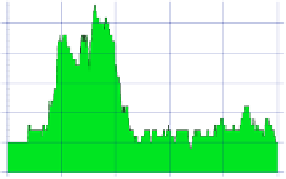
Fig. 5.
Evolution of IS agent concentrations during the primary and secondary re-
sponses in a tissue area
As a result, the infection is stopped within a much shorter time interval, due
to the increased amount of antibodies. Cell-mediated immunity reactions do
start faster as well, but are not as intense as during the first response since
the infection is eliminated more quickly. Consequently, T cells and macrophage
concentrations can remain at a lower level.