Information Technology Reference
In-Depth Information
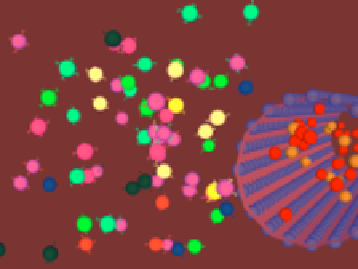
(a) t = 3.2
(b) t= 14.6
(c) t = 57.1
(d) t = 225.0
B
Cells
B
Cells
80
80
60
60
40
40
20
20
0
0
0
0
50
50
100
100
150
150
200
200
250
250
300
300
(e) t = 256.4
(f) Concentration of B cell strands
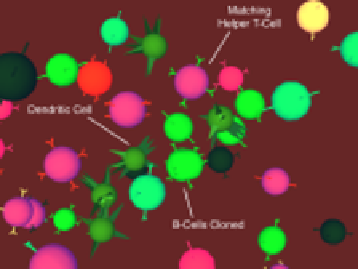
Fig. 3.
Interactions in a
Lymph Node
after a viral infection: (a)-(e) Screen captures
(with time point labels) of the graphical simulation interface during clonal selection
and primary and secondary response to a virus. The virtual cameras are pointed at
a lymph node, in which 8 different strands of B cells are present. (f) The change
in concentration of all B cells (brown filled plot) and per strand. The virus that most
closely matches one of the B cell strands triggers its increased proliferation (green filled
plot). The concentrations of all other strands remain low (line plots at the bottom).