Information Technology Reference
In-Depth Information
r
s
0,0001
0,0002
0,0005
0,001
0,002
0,005
0,01
0,02
0,05
0,02
1
0,018
0,9
0,016
0,8
0,014
0,7
0,012
0,6
0,01
0,5
0,4
0,008
0,006
0,3
0,004
0,2
0,002
0,1
0
0
2
3
4
5
6
7
8
9
10 11 12 13 14 15 16 17 18 19
m
23456789 0 1 2 3 4 5 6 7 8 9
m
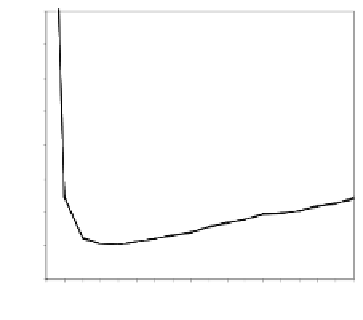
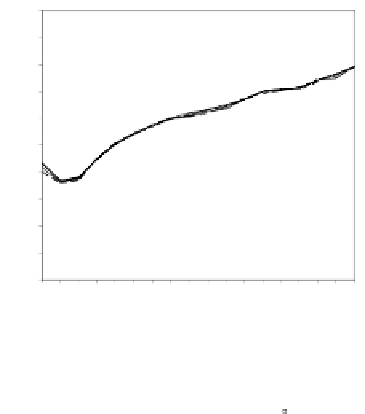
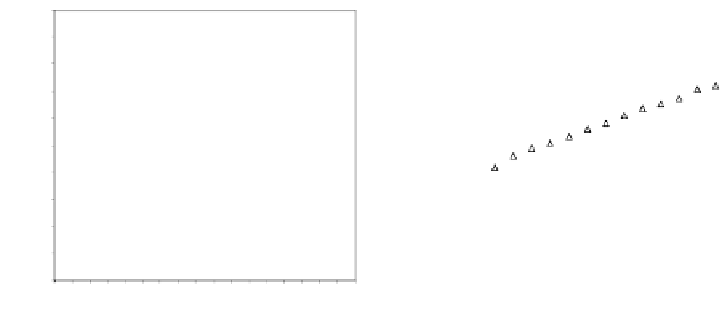
Fig. 2.
The effect of window length
m
on the
false_alarm_rate
(left) and
detection_rate
(right)
r
s
0,0001
0,0002
0,0005
0,001
0,002
0,005
0,01
0,02
0,05
400
0,012
350
0,01
300
0,008
250
200
0,006
150
0,004
100
0,002
50
0
0
2
3
4
5
6
7
8
9
10 11 12 13 14 15 16 17 18 19
m
2
3
4
5
6
7
8
9
10 11 12 13 14 15 16 17 18 19
m
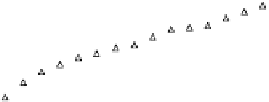
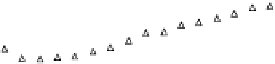
Fig. 3.
The effect of window length
m
on the size of resuzlting detectors set (left) and average
detection rate (right)
As it can be seen on the
Fig. 1
, increasing the window length
m
results in a better
detection. A more accurate analysis requires checking the effect of
m
on DR and FAR
separately on
Fig. 3
.
For a
false_alarm_rate
a well-defined minimum over the
m=5
and
6
can be seen. It
seems then that to minimize the type 1 detection errors the window length
corresponding to the estimated minimal reconstruction dimension can be used.
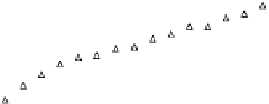
The
detection_rate
clearly increases with
m
. The strange local maximum for the
dimension of
2
is probably due to the fact that the selected reconstruction delay
τ
=50
is valid only for this dimension. This is because only for
m=2
the window lag
τ
w
=(m-
1)
is equal to the suggested value
50
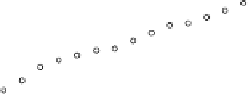
. It can be also seen that the big values of
r
S
have
negative effect o DR. It is caused by the effect of merging the neighbor trajectories in
τ