Information Technology Reference
In-Depth Information
where
N
nei
is the number of neighbors a cell really has. Note that for
N
nei
=6,
(4) reduces to (3).
The virion-related parameters
D
V
,
Δx
,
Δt
in (4), and the release rate of
virions,
g
V
, have been set as follows.
Diffusion Rate of Virions (
D
V
):
The diffusion rate or diffusion coecient for
virions,
D
V
, measures how fast virions spread: the larger
D
V
,thefastervirions
will spread to neighboring sites and then to the entire grid. One way to deter-
mine
D
V
from experimental results is to take a measure of the “patchiness” of
the infection, i.e. the tendency of infected cells to be found in batches. The au-
tocorrelation function offers a good measure of patchiness. Hence, we calibrated
D
V
by visually matching our simulation to the experimental autocorrelation.
We started with
D
V
=3
.
18
10
−
12
m
2
/
s which is the diffusion rate predicted
by the Stokes-Einstein relation for influenza virions diffusing in plasma at body
temperature. Ultimately, we found that
D
V
=3
.
18
×
10
−
15
m
2
/
s, a value 1,000-
fold greater than the Stokes-Einstein diffusion, yielded the best agreement to the
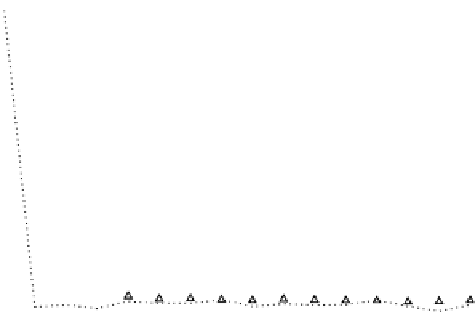
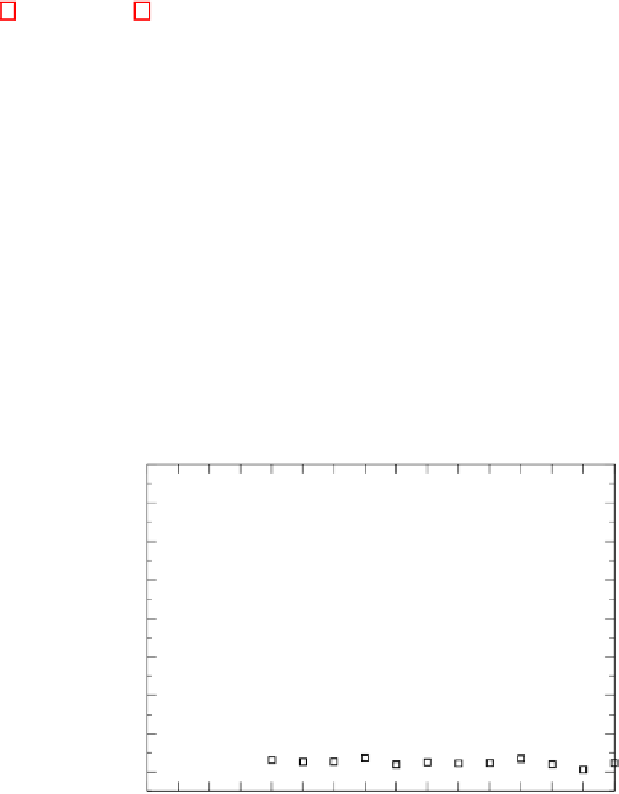
experimental autocorrelation. This is illustrated in Fig. 3 where the experimental
autocorrelation is plotted against simulation results for different values of
D
V
.
×
1.0
0.9
0.8
0.7
0.6
0.5
0.4
0.3
0.2
01234
56
7
8
9
10
11
12
13
14
15
lag (number of sites away)
Fig. 3.
Autocorrelation at 24 h post-harvest for the experiments (full line, full cir-
cles) compared against the autocorrelation produced by the simulation when using
a diffusion coecient of
D
V
=3
.
18
×
10
−
12
m
2
/
s (dotted line, empty squares), and
D
V
=3
.
18
×
10
−
15
m
2
/
s (dashed line, empty triangles). All parameters are as in Ta-
ble 1 except for the
D
V
=3
.
18
×
10
−
12
m
2
/
s simulation where
k
was set to 4 per
virions per hour to preserve the same fraction of cells infected at 24 h post-harvest.
The autocorrelation have been “normalized” to be one for a lag of zero.
Grid Spacing or Diameter of Epithelial Cells (
Δx
):
The diameter of
epithelial cells was estimated from “en face” and cross-section pictures of the
experimental monolayer. The average epithelial cell diameter was found to be
about 11
±
1
µ
m. We use
Δx
=11
µ
m.