Information Technology Reference
In-Depth Information
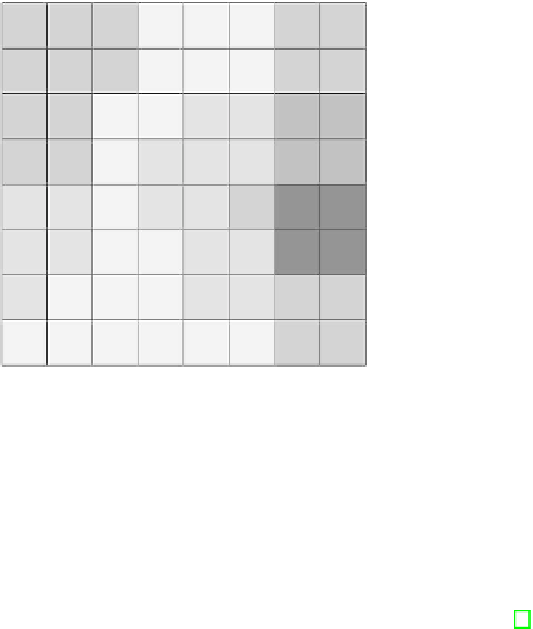
Fig. 3.
Self-Organizing Map trained using data acquired from the simulated robot
control system. The upper left corner represents normal operation states, and the
dark patch in the lower right quadrant represents states where many or all of the
TLRs are responding. Other regions of the map represent states where fewer TLRs are
responding.
3.3
Self-organizing Maps
The higher level state representation of the robot is encoded using a SOM [5].
The strength of a SOM algorithm in the context of this work is the way it
deals with multidimensional input vectors. The algorithm is able to cope with
large amounts of n-dimensional data and find correlations between them. This
means that a system incorporating a SOM is highly scalable, as large numbers
of input sensors can be dealt with. Upon finding a correlation between input
vectors, the algorithm locates an appropriate neuron within the SOM, which
consequently gets activated. This process is performed in an unsupervised man-
ner, thus avoiding tedious and possibly inaccurate supervised methods, which
would only allow a limited set of states to be represented within the map. A
SOM is a low dimensional representation of the input data which preserves the
topological properties of the input and explicitly represents multiple relation-
ships between similar states. This feature enables the proposed system to evolve
the map in a way which can be exploited for the purpose of inflammation. Neu-
rons within the SOM which are topologically in close proximity represent states
with certain similarities and thus result in only slightly different responses when
activated. This is in contrast to most traditional statistical analysis methods
such as cluster analysis or minimal spanning trees which do not unambiguously
and explicitly represent such rich relationships between data items. The SOM
also allows the possibility of learning on-the-fly without requiring discontinuous
reorganisations of the state map which can result using statistical analyses such
as cluster analysis.