Information Technology Reference
In-Depth Information
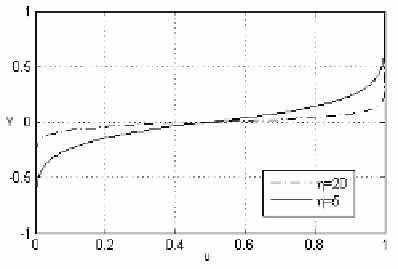
Fig. 2.
The influence of
η
over
γ
, as a function of
u
The parameter
η
is responsible for the amplitude of the mutation and is
defined according to each individual (parent antibody) fitness. Several tests were
made and it was empirically defined that
η
[5
,
20], which makes
γ
vary with
u
(
u
is a random number) in the region between the two boundaries (dashed and
full curves) in Figure 2.
Since it is desired a mutation rate inversely proportional to the fitness, be-
fore the cloning process the population of antibodies is ranked and divided into
ordered classes (as will be explained in Subsection 4.2). The individuals of the
first class receive the value
η
= 20 (smaller variation), the individuals of the
last class receive
η
= 5 (greater variation) and the individuals of the remaining
classes receive
η
values equispaced in [5, 20], always giving higher values of
η
to
individuals in the best classes (better individuals).
∈
4.2
Selection, Ranking and Grid Processes
After the cloning and hypermutation phases, the algorithm has now a population
of size
N
=
N
+
N
N
c
(where
N
is the size of the original population and
N
c
is the number of clones per individual). From this population, the
N
best
individuals should be selected to constitute the new antibody population. This
selection phase is described in Algorithm 1.
×
Algorithm 1.
Pseudo-code for the selection phase.
[
F
1
,
F
2
,
...
]
←
ranking(
P
t
);
Best class in
F
1
and so on.
P
t
+1
←∅
;
Initializing the new population
j ←
1;
while
|P
t
+1
F
j
|≤N
do
P
t
+1
← P
t
+1
F
j
;
Inserts the
j
-th class in the population
j
←
j+1;
end while
L ← j
;
Last class to be included (partially)
rem ← N −|P
t
+1
|
;
Num. of individuals that still can be inserted in the pop.
P
g
←
grid(
F
L
,rem);
Selection of the remaining individuals
P
t
+1
← P
t
+1
P
g
;