Information Technology Reference
In-Depth Information
4.1 Experiment 1 (25000 Evaluations)
In this experiment, the number of iterations was set to 280, IN = 7,
δ
= 0.4, and
N
cmax
= 95 for all four test problems;
= 0.0074 for ZDT1~ZDT3 and 0.0078 for ZDT4 so
that the final population size and evaluations are around 100 and 25000 respectively.
The results are obtained as the average values of 10 independent runs and are shown
in Fig. 2.
σ
Iteration= 280
Iteration= 280
Iteration= 280
Iteration= 280
0.9
1
1
1
1.4
0.9
0.8
1.2
0.8
0.8
0.6
0.7
1
0.7
0.4
0.6
0.6
0.8
0.2
0.5
0.5
0
0.6
0.4
0.3
0.4
-0.2
0.3
0.4
-0.4
0.2
0.2
0.2
0.1
0.1
-0.6
0
0
-0.8
0
0
0.1
0.2
0.3
0.4
0.5
0.6
0.7
0.8
0.9
1
0
0.1
0.2
0.3
0.4
0.5
0.6
0.7
0.8
0.9
1
0
0.1
0.2
0.3
0.4
0.5
0.6
0.7
0.8
0.9
0
0.1
0.2
0.3
0.4
0.5
0.6
0.7
0.8
0.9
1
Popul
a
tion size
V
s iteration
Popul
a
tion size
Vs
iteration
Population size Vs iteration
Popul
at
ion size
V
s iteratio
n
100
100
100
100
90
80
90
90
90
80
80
80
70
70
70
60
70
60
60
60
50
50
50
50
40
40
40
40
30
20
30
30
20
30
20
20
10
10
10
0
10
0
0
0
0
50
100
150
200
250
0
50
100
150
200
250
0
50
100
150
200
250
0
50
100
150
200
250
Adaptive clone size Vs iteration
Adaptive clone size Vs iteration
Adaptive
clone siz
e
Vs iterat
i
on
Adaptive clone size Vs iteration
100
100
100
60
90
90
90
50
80
80
80
70
70
70
40
60
60
60
30
40
50
40
50
50
40
20
30
30
20
30
20
20
10
10
10
10
0
0
0
0
0
50
100
150
200
250
0
50
100
150
200
250
0
50
100
150
200
250
0
50
100
150
200
250
ZD T1
ZD T2
ZD T3
ZD T4
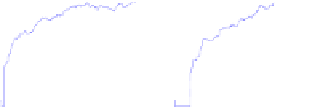
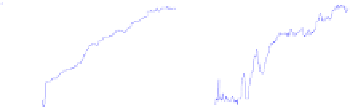
Fig. 2.
(a) Pareto solutions obtained by PAIA on ZDT1~ZDT4; (b) Adaptive population size Vs
iteration; (c) Adaptive clone size (the assigned maximum clone size among all Abs) Vs
iteration
Table 1.
Mean and variance values relating to the convergence measure GD
ZDT1
GD
ZDT2
GD
ZDT3
GD
ZDT4
GD
Algorithm
2
2
2
2
σ
σ
σ
σ
NSGA II
8.94e-4
0
8.24e-4
0
4.34e-2
4.20e-5
3.228
7.3076
SPEA
1.25e-3
0
3.04e-3
2.00e-5
4.42e-2
1.90e-5
9.514
11.321
VIS
1.81e-3
1.97e-7
1.21e-3
1.04e-6
1.58e-3
2.26e-7
0.1323
4.20e-2
PAIA
1.43e-4
1.56e-9
1.04e-4
2.2e-11
1.58e-4
4.6e-10
1.20e-3
1.88e-7
The results shown in Tables 1, 2 and 3 indicate that PAIA reached a better per-
formance than any of other three algorithms using similar evaluation times. From Fig.
2 (b), one can see that the population adaptively increases/decreases during each itera-
tion step and can be finally controlled by
, which means that only necessary Abs are
maintained during the search and at the end. From Fig. 2 (c), one can see that the
clone size is adaptively decided by the number of selected Abs and their correspond-
ing affinities. If the number of selected Abs is small, each selected Ab can be assigned
a large clone size so that the population is large enough to explore the objective space.
σ