Information Technology Reference
In-Depth Information
D
N
N
Table 6.
Comparisons on
between h-NSA and t-NSA when fixing
and varying
R
R
S
N
Max
D
Min
D
AVG
D
STDDEV
S
R
R
R
h-NSA
0.9543
0.9303
0.94203
0.008844
50
t-NSA
0.1876
0.1814
0.1849
0.002486
h-NSA
0.8474
0.7381
0.79412
0.028445
100
t-NSA
0.1894
0.1751
0.18214
0.004446
h-NSA
0.6863
0.5956
0.63463
0.032304
200
t-NSA
0.1911
0.1751
0.18222
0.005227
h-NSA
0.5652
0.5154
0.53954
0.019914
300
t-NSA
0.1882
0.1763
0.18168
0.003982
h-NSA
0.5125
0.4433
0.48044
0.025536
400
t-NSA
0.1868
0.1709
0.17724
0.005197
h-NSA
0.4869
0.3991
0.44081
0.027283
500
t-NSA
0.1789
0.1674
0.17409
0.003515
h-NSA
0.4684
0.3966
0.43301
0.025968
600
t-NSA
0.1803
0.164
0.17158
0.005298
h-NSA
0.4454
0.3975
0.41809
0.015273
700
t-NSA
0.1782
0.1645
0.17116
0.00441
h-NSA
0.4425
0.3809
0.40513
0.020728
900
t-NSA
0.1772
0.1663
0.17173
0.003877
h-NSA
0.4121
0.3635
0.38717
0.016699
1100
t-NSA
0.1771
0.1567
0.16774
0.00544
0.035
1
0.9
0.03
h-NSA
t-NSA
0.8
0.025
0.7
0.6
0.02
0.5
H-NSA
T-NSA
0.015
0.4
0.3
0.01
0.2
0.005
0.1
0
0
50
100
200
300
400
500
600
700
900 1100
50
100
200
300
400
500
600
700
900 1100
(a)
(b)
D
N
N
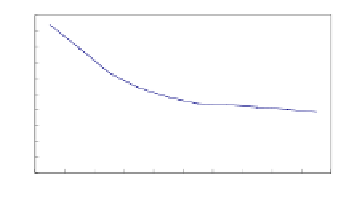
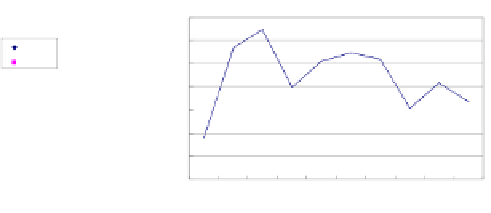
Fig. 6.
(a)Comparisons on
between h-NSA and t-NSA when fixing
and varying
;
R
R
S
D
N
N
(b) Standard deviation of
between h-NSA and t-NSA when fixing
and varying
R
R
S
From Table 6 and Fig. 6, when the
N
is fixed, the detection ratio
D
of h-NSA
R
R
decrease with the increment of
N
. However, the
D
of h-NSA is always higher
S
R
than it of t-NSA. From Table 6, the
D
of t-NSA decreases slowly. It is noted that as
R