Information Technology Reference
In-Depth Information
IDS and consequently producing distinct alerts. Parenthetically, many IDS sig-
natures contain within them meta-data such as the Bugtraq or Mitre Common
Vulnerabilities and Exposures (CVE) identification numbers which allows this
function to be implemented automatically.
With our assumptions stated we may proceed to define our correlation graph.
The output graph, G, is defined as a DAG with exploit vertices (V
e
), condition
vertices (V
c
)andedges(E):
G
=
V
e
∪
V
c
∪
E
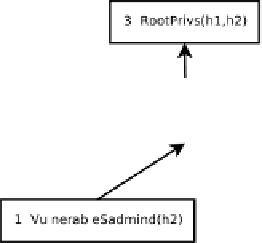
Fig. 1.
Example output graph (conditions are boxes and exploits are ellipses)
The two types of vertex are necessary for being able to represent both conjunc-
tive and disjunctive relations between exploits. As we can imagine by looking at
Figure 1, any number of exploits may lead to condition 3, namely compromise of
root privileges. This would mean that either the “AMSLVerify” exploit
or
some
other root exploit may precede “Mstream Zombie Download.” In another situa-
tion we may want “AMSLVerify”
and
some other exploit to be the precondition.
In this case we would simply introduce another pre-requisite condition for that
exploit alongside condition 3.
Each disconnected subgraph is considered as a threat scenario. That is to
say, a structured set of low level alerts which constitute a single logical attack
sequence.
There is a function “vertexstate” (
VERTEX
→
VERTEXSTATE
)which
returns a 3 valued type,
for hypothesised, real or pre-
dicted respectively. Condition vertices have a function “val” (
VERTEX
{
HY P, REAL, P RED
}
→
BOOL
) which tells us the value of the condition.
In addition to this, exploit vertices contain information about the computer
systems involved. Functions for retrieving source and destination addresses and