Information Technology Reference
In-Depth Information
(a)
r
=2
(b)
r
=2
,π
(c)
r
=3
(d)
r
=3
,π
(e)
r
=4
(f)
r
=4
,π
(g)
r
=5
(h)
r
=5
,π
(i)
r
=6
(j)
r
=6
,π
(k)
r
=7
(l)
r
=7
,π
(m)
r
=8
(n)
r
=8
,π
(o)
r
=9
(p)
r
=9
,π
(q)
r
=10
(r)
r
=10
,π
(s)
r
=11
(t)
r
=11
,π
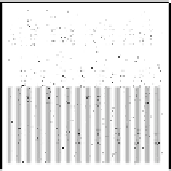
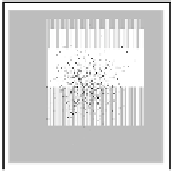
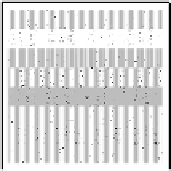
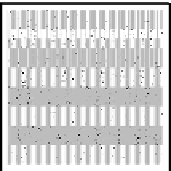
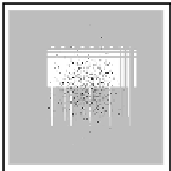
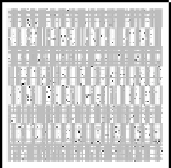
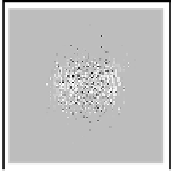
Fig. 5.
A visualized simulation run, with 1000 random (self) points generated by a
Gaussian distribution with mean
μ
=0
.
5andvariance
σ
=0
.
1. The grey shaded area
is covered by the generated
r
-chunk detectors, the white areas are holes. The black
points are self elements. The captions which include a “
π
” are simulations results with
the randomly determined permutation mask
π ∈ S
16
.