Information Technology Reference
In-Depth Information
Stimulation > 10000 (U)
100
"comp.upper"
"comp.lower"
90
80
70
60
L<stimluation<U
50
40
30
20
10
0
0
10
20
30
40
50
60
70
80
90
100
Stimulation<100 (L)
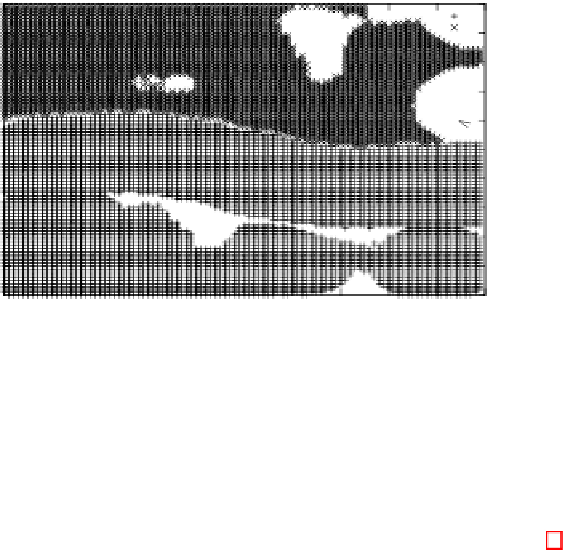
Fig. 3.
Stimulation observed at potential site of the grid following emergence of the
network
more insight into the model by examining the field that would be received by
a hypothetical cell occupying each of the potential sites on the grid given the
existing network. This field is calculated according to equation 1. Concentration
of all cells is assumed to be 1 to make visualisation of the field easier (without
loss of generality). The result is illustrated in figure 2, in which darker shading
indicates higher field, and vice-versa. The top half of the diagram clearly shows
a zone in which all potential sites experience some field; the strength of the field
itself varies throughout the zone. In the lower half of the diagram, the majority of
sites experience no field at all (antibodies cannot survive in the complementary
zone) therefore are tolerant to any cell. Transient reactive regions occur in this
region; due to the nature of the algorithm, cells are continuously added to the
grid and survive for a minimum of 10 iterations. If these cells occur in the intol-
erant zone, they temporarily stimulate cells in the lower half — observe however
that the shading indicates the reactivity is very low at these sites. The effect the
field has on survival of potential cells is illustrated in figure 3 for antibody cells.
This figure does account of the concentration of cells at iteration 10000 when
calculating stimulation at each site: the upper zone shows sites in which the total
stimulation received at a site is greater than 10000 (therefore concentration of a
cell at that site decreases). The marked sites in the lower zones represent sites
at which the stimulation received at the site is less that 100 which also results in
a concentration decrease. Sites at which nothing is marked indicate those places
in which the stimulation falls between the lower and upper limits and therefore
the concentration of cells at these sites rises. The sites therefore occur along the
boundary lines of the zones, and in the transient regions. For antigens, their
concentration is decreased if their total stimulation exceeds the lower limit
L
.


