Agriculture Reference
In-Depth Information
4.2.
Balance of Beet Dry Matter
Table 3 also indicates actual agriculture yields Y
A
per unit area and year, as well as the
contents x
S
of sugar - or starch in cereal case - and that of dry matter DM in crops, as
received at the factory. To draw a correct comparison between Y
A
of sugar plants, total
cane production in 2012 is reported against all the area dedicated to the culture, which
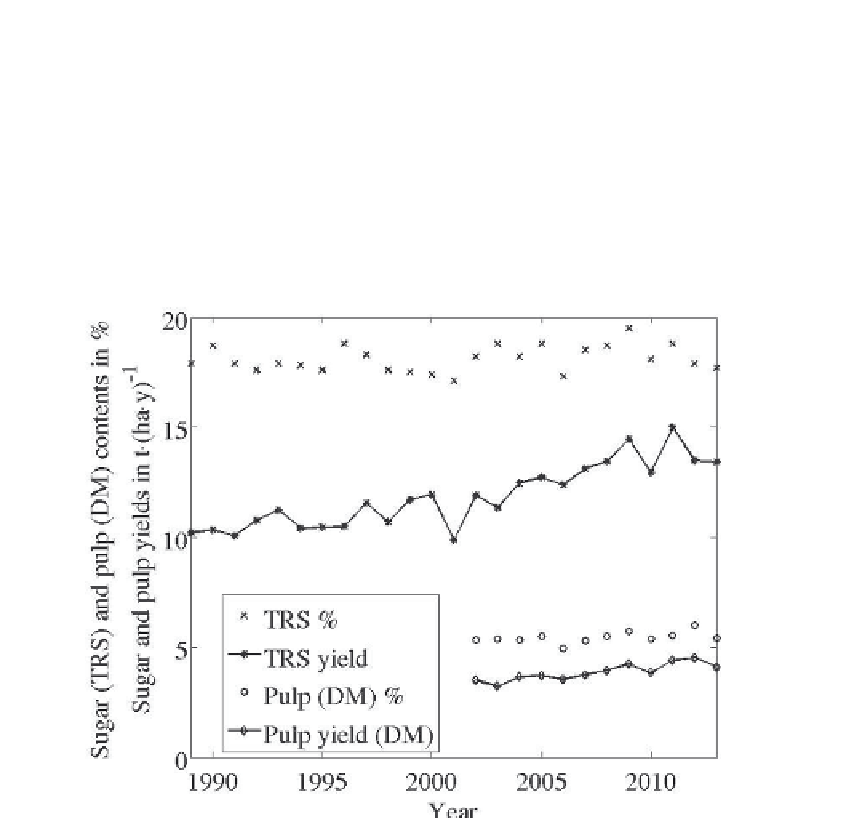
includes the fallow part [8]. Sugar content of beet roots in France, which has remained
stable in average over the last decades (see Fig. 3), corresponds to its mean over the last ten
years, x
S
= 183
kg
S
·
t
−
1
.
A
Figure 3. Evolution in France since 1990 of the country averaged contents in beet root of
sugar (TRS) and beet pulp on a dry basis (DM), as well as their annual yields per unit of
planted area. Information on pulp was not available before 2002. Sources: CGB, Agreste.
For all crops ethanol yield Y
OH
per unit area and year is deduced from:
Y
OH
=
Y
A
x
OH
LH V
m
,
(2)
where x
OH
is the ethanol yield at the factory in kg
·
t
−
1
and LH V
m
ethanol LHV per unit
A
mass (26.8 MJ
·
kg
−
1
).
For sugar plants x
OH
depends on x
S
according to:
x
OH
= 0
.
511
α
OH
x
S
.
(3)
The factor 0.511 results from the stoechiometric coefficients of the transformation of glu-
cose into ethanol. However, only a fraction α
OH
of sugar is converted into ethanol, even
in ideal conditions, due to losses and parasitic reactions [2]. The highest yield, or Pasteur
yield, is
0
.
947
and in practice α
OH
is lower than 0.93.