Database Reference
In-Depth Information
Impala. Once the Cloudera Manager web-based user interface is in front of you, just
select
Service impala1
from the
Services
list, and then you have multiple ways
to start, stop, and restart both the Impala daemon(s) and statestore service directly
from there. You can also change the Impala configuration, view log files, manage
Impala nodes, and troubleshoot some of the problems just by opening the Impala
debugging interface.
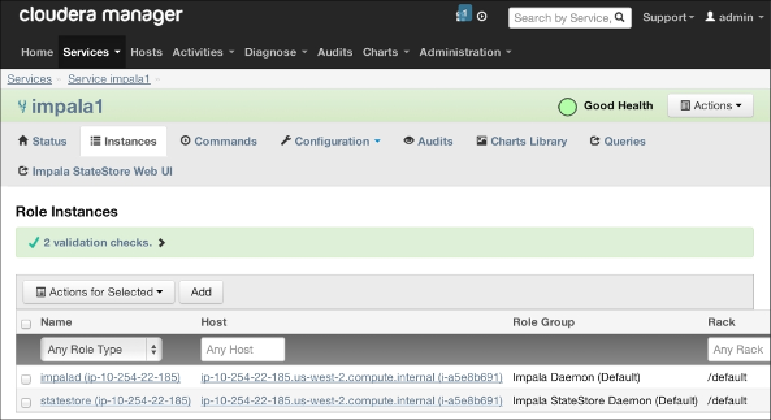
In the next few screenshots, let's see how you can use the Cloudera Manager web-
based user interface to manage Impala:
In the preceding screenshot, you can see the list of Impala daemons and statestore
services running that can be managed. In the
Queries
tab, you can search the SQL
statement directly from the Impala web interface and look at various graphs and
charts to understand query performance.
In the following screenshot, you can learn configuring Impala auditing features with
Impala 1.1.x and above. This configuration helps you to input an auditing scheme
based on
Username
,
Role
, and
Host Ip Address
and, based on that, you can ana-
lyze the logs directly on the web or download them for further processing.