Graphics Reference
In-Depth Information
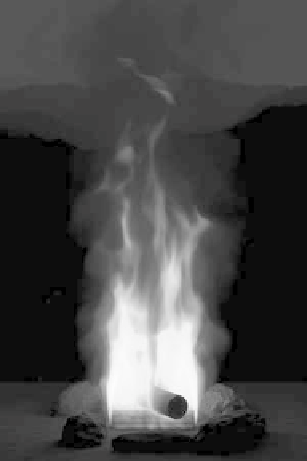
Figure 3.18
Rendered image of fire. (From [Nguyen et al. 02]
c
2002 ACM, Inc. Included here by
permission.) (See Color Plate I.)
The flame is then rendered using ray marching, but because the emission char-
acteristics are modeled as spectral distributions, the ordinary RGB model, which
essentially has three spectral samples, is not sufficient. Such cases require a more
finely sampled spectral representation which is later converted to RGB for display
on a monitor. The process, which was developed by color scientists early in the
twentieth century, works by integrating the spectral representation against three
empirical
tristimulus
response curves to produce three components for the color.
Normally these are converted to RGB via a linear transformation based on the
characteristics of the monitor, but the authors found that the usual conversion pro-
cess causes the flame to appear too red. The reason is that flame is usually seen
only in dark conditions where human vision has become dark adapted. (Flames do
appear much redder in daylight.) To account for this, the authors employ a color
shift to mimic the perceptual change in color caused by dark adaptation. This shift
is applied when the Plank curve is integrated, so the rest of the implementation
can use the usual RGB representation.
Scattering within flame is comparatively small, so the in-scattering computa-
tion can be done with relatively few samples. In this case it turns out to be more
efficient to approximate the in-scattering integral directly from sample rays, rather
than incurring the overhead of the volume photon map construction.