Graphics Reference
In-Depth Information
(a)
(b)
(c)
Figure 8.44
Separation results. (From [Nayar et al. 06]
c
2006 ACM, Inc. Included here by permis-
sion.)
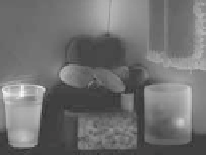
unaltered image of the scene captured under full illumination. Parts (b) and (c)
contain the direct and global components separated using the checkerboard illumi-
nation. These images are an example of a “successful” separation: the computed
direct and global images match expectations. In the image representing direct
lighting (
Figure 8.44(b)
)
the parts of the scene where global effects dominate—
the glass of diluted milk, the translucent container, and the interreflection on the
walls—are appropriately dark. In the global illumination image, those areas are
the brightest. (The computed images in Figure 8.44 have been brightened some-
what for clarity.)
The corresponding set of images in Figure 8.45 show an example of “failed”
separation. The scene consists of three diffuse walls and mirror sphere. The re-
flection off the sphere has (nearly) an infinitely high frequency: the specular lobe
is nearly an infinitely narrow Dirac
. The reflection off the sphere therefore
does not smooth out the incident illumination—it reflects the checkerboard pat-
tern onto the walls. Consequently, the value of
L
g
[
δ
is not smooth enough for
the approximation of Equation (8.12) to apply. In other words, the two-bounce
illumination retains the high frequency pattern of the light. The checkerboard pat-
tern is actually visible on the walls of the (incorrectly) computed direct and global
images.
c
,
i
]
(a)
(b)
(c)
Figure 8.45
Separation results. (From [Nayar et al. 06] c
2006 ACM, Inc. Included here by permis-
sion.)


