Graphics Reference
In-Depth Information
7
6
5
4
3
2
1
0
-80
-60
-40
-20
0
20
40
60
80
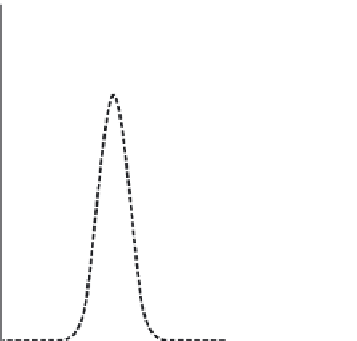
Figure 8.12
Fitting measured data to the Ward model. (From [Ward 92]
c
1992 ACM, Inc. Included
here by permission.)
version of the model is given by
sin
2
tan
2
cos
2
k
x
+
k
y
))
exp
(
−
α
(
β
/
β
/
1
√
cos
.
(8.6)
θ
i
cos
θ
r
4
π
k
x
k
y
The parameters
k
x
and
k
y
control the reflection character; they represent the falloff
in the
x
and
y
directions, respectively, and can be fit to the data captured by Ward's
measurement system. Note that when
k
x
=
k
y
, Equation (8.6) reduces to Equa-
tion (8.5). Applying an anisotropic reflection model requires choosing a coordi-
nate system on the surface. The
x
-axis is typically aligned with the orientation of
the surface microgeometry, e.g., the scratch directions of brushed or milled metal,
or the grain direction in wood.
Figure 8.13 shows the results using the Ward model. The left image is the
captured photograph, the middle is the rendered result using the isotropic Ward
model, and the right is that using the anisotropic Ward model.
Ward's image-based approach to measuring BRDFs has some significant ad-
vantages over conventional gonioreflectometry measurement. Because each indi-
vidual pixel in a captured image represents a measurement, a single image cap-
tures the equivalent of thousands (or millions) of measurements for a particular
light direction. Not only is this much less time intensive than acquiring each mea-
surement directly, it results in a much denser sampling in the outgoing directions
than is practical from individual measurements. A set of measurements recorded
by a gonioreflectometer is usually too sparse for direct rendering, so some form
of interpolation between samples is needed. This is a difficult 4D “scattered data”