Graphics Reference
In-Depth Information
(a)
(b)
(c)
(d)
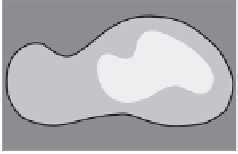
Figure 7.6
Clustering stages for structured importance sampling an environment map. (a) The map
is partitioned into levels (areas) of similar brightness. (b-d) Each layer is partitioned into
strata based on selected sample points, proceeding from the brightest to the dimmest levels
layers. Note the samples are most dense in the brightest layer, and become more sparse
in the dimmer layers. (From [Agarwal et al. 03] c
2003 ACM, Inc. Included here by
permission.)
LightGen w/300
Structured w/300
(a)
(b)
Figure 7.7
Rendering using structured importance sampling, using 300 samples (point sources) to
represent the environment map. (a) Image rendered using structured importance sampling.
(b) Magnifications of the marked rectangles in (a). The images in the left column were
rendered by LightGen and are included for comparison. LightGen employs the
k
-means
algorithm; the discrete levels visible in the shadow are an artifact of poor sampling density
in bright parts of the environment map. (From [Agarwal et al. 03]
c
2003 ACM, Inc.
Included here by permission.)