Geoscience Reference
In-Depth Information
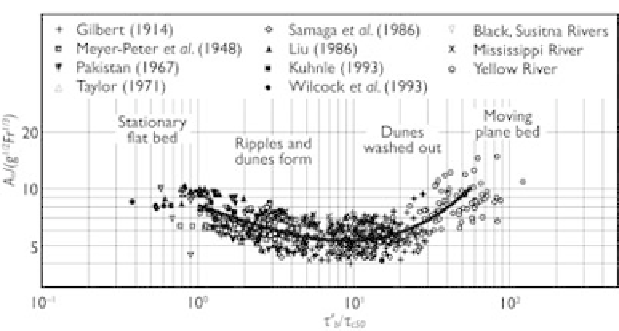
Figure 3.13
Relation between
A
n
/(
g
1
/
2
Fr
1
/
3
)
and
τ
b
/τ
c
50
(Wu and Wang, 1999).
3.3.4 Comparison of movable bed roughness
formulas
The movable bed roughness formulas of Li and Liu (1963), van Rijn (1984c), Karim
(1995), andWu andWang (1999) were tested against 4,376 sets of flume and field data
collected by Brownlie (1981). These data sets were measured by many investigators
in several decades, covering flow discharges of 0.00263-28825.7 m
3
s
−
1
, flow depths
of 0.04-17.3 m, flow velocities of 0.2-3.32 m
s
−
1
, bed slopes of 0.00002-0.067,
sediment median diameters of 0.011-76.1 mm, and sediment size standard deviations
up to 9.8. Table 3.2 compares the measured and predicted flow depths. It can be
seen that the van Rijn, Karim, and Wu-Wang formulas almost have the same level
of reliability for predicting the flow depth. As compared with the Li-Liu formula, the
Wu-Wang formula has much improvement.
·
Table 3.2
Comparison of measured and predicted
flow depths
Error range
% of calculated flow depths in error range
Li-Liu
van Rijn
Karim
Wu-Wang
±
10%
21.8
44.0
41.0
41.5
±
20%
41.8
77.9
74.9
75.9
±
30%
58.8
91.4
91.0
94.4
3.4 BED-LOAD TRANSPORT
Laboratory experiments and field measurements have revealed that the sediment trans-
port rate (or concentration) at an equilibrium state in a steady, uniform flow, which
is often termed as the sediment transport capacity or the capacity of flow-carrying