Geoscience Reference
In-Depth Information
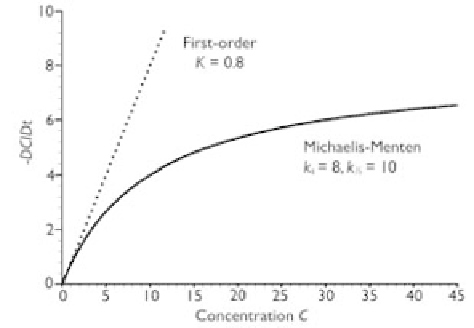
Figure 12.2
Linear and Michaelis-Menten kinetics.
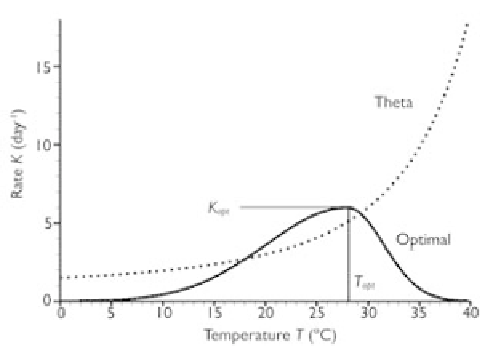
Figure 12.3
Rate coefficient as function of temperature.
growth rate at an optimal temperature, and then decreases at higher temperatures.
Several models have been used in the literature to represent this trend (Chapra, 1997,
p.605). For example, Cerco and Cole (1994) suggested the following formulation
based on the normal distribution:
K
opt
e
−
κ
1
(
T
−
T
opt
)
2
T
≤
T
opt
(
)
=
K
T
(12.52)
K
opt
e
−
κ
2
(
T
opt
−
T
)
2
T
>
T
opt
κ
2
are the shape factors for the relationships of growth to temperatures
blow and above the optimal temperature
T
opt
, respectively; and
K
opt
is the optimal
rate coefficient at
T
opt
. The relation of Eq. (12.52) is depicted in the solid line in
Fig. 12.3.
κ
1
and
where