Geoscience Reference
In-Depth Information
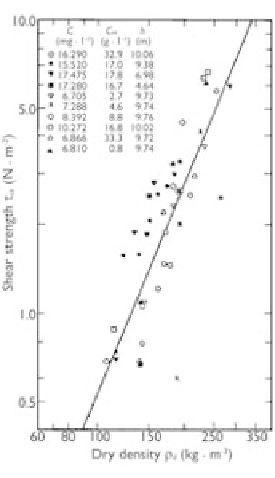
Figure 11.10
Bed shear strength as function of bed density (Owen, 1975).
ρ
d
at
the bed surface for the Grangemouth, Belawan, and Brisbane muds in saline water.
They obtained
Thorn and Parsons (1980) likewise found a power relation between
τ
ce
and
10
−
6
and
2.28.
Nicholson and O'Connor (1986) approximated the relation between
ς
=
5.42
×
β
=
τ
ce
and
ρ
d
obtained by Thorn (1981) for the mud from Scheldt, Belgium, as follows:
n
τ
=
τ
+
k
τ
(ρ
−
ρ
)
(11.26)
τ
ce
ce
0
d
d
0
where
ρ
d
0
are the critical shear stress
and bed density in the initial period of bed formation,
k
τ
is a coefficient of 0.00037,
and
n
τ
is an exponent of about 1.5.
ρ
d
is the dry density of bed material,
τ
ce
0
and
11.2 MULTIPLE-FLOC-SIZE MODEL OF COHESIVE
SEDIMENT TRANSPORT
As described in Section 11.1.1, the size distribution of flocs varies with time, due to
the consecutive aggregation and disaggregation processes. Even for the flocs generated
from uniform dispersed sediment particles, their size distribution is quite non-uniform
and dynamic. For the convenience of analysis, the size distribution of flocs is often
represented by a discrete number of size fractions, as shown in Fig. 11.3. The number
of flocs in size fraction
k
per unit volume is denoted as
n
k
. The governing equation for