Geoscience Reference
In-Depth Information
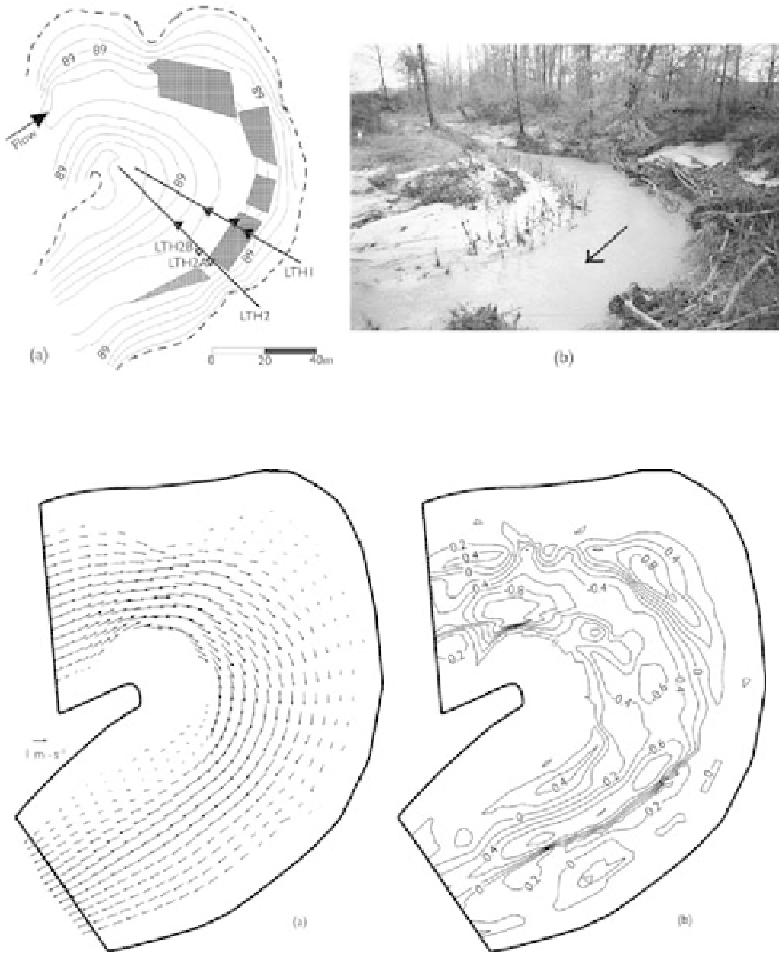
Figure 10.16
(a) Map of study site and (b) photo facing upstream in Little Topashaw Creek (contours
represent bed elevation, in m; shaded areas are wood structures).
Figure 10.17
(a) Simulated flow at
Q
=
42.6 m
3
s
−
1
and (b) simulated bed change (m) in 2000-2001.
during a flow event with a peak of 15.5 m
3
s
−
1
. Instrument LTH2A was secured
to the bed immediately downstream from a large wood structure, while instrument
LTH2B was secured to the bed along the same cross-section but at the centerline of
the base flow channel. Measured velocities were noisy due to turbulent fluctuations,
acoustic interference fromfloating and suspended trash and debris, and factors internal