Geoscience Reference
In-Depth Information
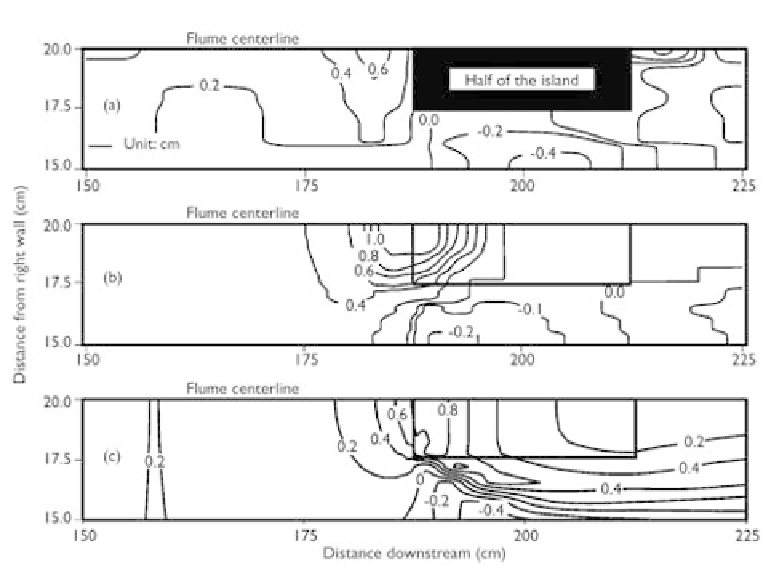
Figure 10.15
Bed changes around vegetated island: (a) measured by Tsujimoto (1998), (b) calculated
by Tsujimoto (1998), and (c) calculated by Wu and Wang (2004).
about 6 m long and were anchored into the bank toe. Acoustic Doppler velocimeters
were used to measure flow depth and vertically-averaged velocity during high flows.
Conditions during the period from June 2000 to June 2001 were numerically sim-
ulated using the depth-averaged 2-D model (Wu
et al
., 2005). Flow records (15-min
interval) from a gage about 1 km upstream from the study reach were used as the
inflow condition, and water surface elevations recorded by one of the acoustic Doppler
devices were extrapolated to the downstream end of the reach and used as the water
level boundary condition. The bed material in the study reach was quite uniform and
the median size was about 0.26 mm. TheManning roughness coefficient was estimated
as 0.028. The average diameter of the logs was about 0.3 m, and the vegetation con-
centration was about 20%. The shape factor
v
was set as 0.5 because the large wood
structures were irregular and inclined. The product of
α
v
and
C
d
was 2.0, which was
calibrated using the measured flow velocity. The suspended-load adaptation coefficient
α
α
was set as 0.5, and the bed-load adaptation length
L
b
was 20 m. The dispersion terms
in the momentum equations and suspended-load transport equation were evaluated
using the algebraic model in Section 6.3, with coefficients
β
I
and
λ
t
given 1.0 and 3.0,
respectively. The computational time step was 2 minutes.
Fig. 10.17(a) shows the simulated flow field at a discharge of 42.6 m
3
s
−
1
, which was
almost the highest flow in the simulation period. The flow was retarded by the large
wood matrices along the left bank and accelerated in the main channel. Fig. 10.18
compares the measured and predicted velocities at locations LTH2A and LTH2B