Geoscience Reference
In-Depth Information
using Eqs. (5.34) and (5.36). The sediment transport capacity is determined using the
Wu
et al
. (2000b) formulas (3.80) and (3.102) without the correction described in
Eq. (9.67). The numerical algorithm presented in Section 9.2 is used to solve these
equations. In particular, the hydrodynamic equations are solved using the method of
Ying
et al
. (2004) with slight modification to accommodate the differences between
two sediment transport models. The details are not repeated here.
The model is tested against the experiments of Chinnarasri
et al
. (2003) on the
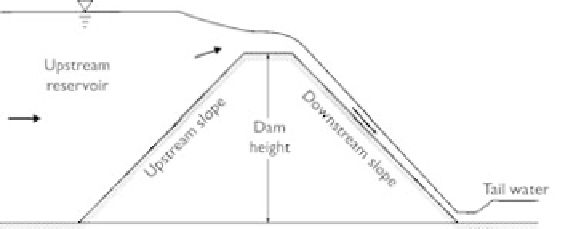
dam (dike) surface erosion process due to overtopping flow. The experimental setup
is sketched in Fig. 9.13. The experimental flume was 35m long and 1 m wide.
A dam across the flume width was located at 17.5m downstream of the inlet. The
dam was 0.8m high, and its crest was 0.3m wide. The upstream and downstream
slopes of the dam were 1V:3H and 1V:2.5H for the simulated experimental run 2.
The dam was made of medium sand with a diameter of 0.86mm. With a constant
inflow discharge of 1.23 l
s
−
1
, the upstream water level was increased initially to a
desired height (0.03m above the dam crest) and held by a vertical plate at the crest.
The vertical plate was then instantaneously lifted up to allow overtopping flow to
start. The overtopping flow discharge and erosion rate were small, due to a low water
height above the crest at the beginning, which increased rapidly after a certain period
and then decreased. The dam surface became wavelike in shape as anti-dunes appeared
and moved upstream. The bed-material porosity is estimated as 0.35, the Manning
n
is 0.018, and the sediment adaptation length
L
t
is 0.05m in the simulation.
A uniform mesh covering the entire flume is used. According to trials using various
grid spacings, the occurrence of anti-dune waves in the simulation depends on the ratio
of grid spacing and adaptation length,
·
L
t
. If this ratio is less than about 0.6, anti-
dune waves appear. This implies that the computational mesh should be fine enough
to simulate the anti-dunes. A 1-D model might not capture the anti-dunes accurately,
and the measurement did not quantify them; thus, only the mean flow and sediment
transport patterns are simulated by using a coarse mesh with a grid spacing of 0.05m
(i.e.,
x
/
1).
Fig. 9.14 shows the longitudinal profiles of the simulated water level, Froude
number, and sediment concentration at elapsed times of 30 and 150 s. The flow is
subcritical in the upstream reservoir; it changes to supercritical on the downstream
slope and then to subcritical in the downstream tailwater. A hydraulic jump appears
at the end of the downstream slope. The sediment concentration on the downstream
x
/
L
t
=
Figure 9.13
Sketch of overtopping flow over a dam (side view).