Geoscience Reference
In-Depth Information
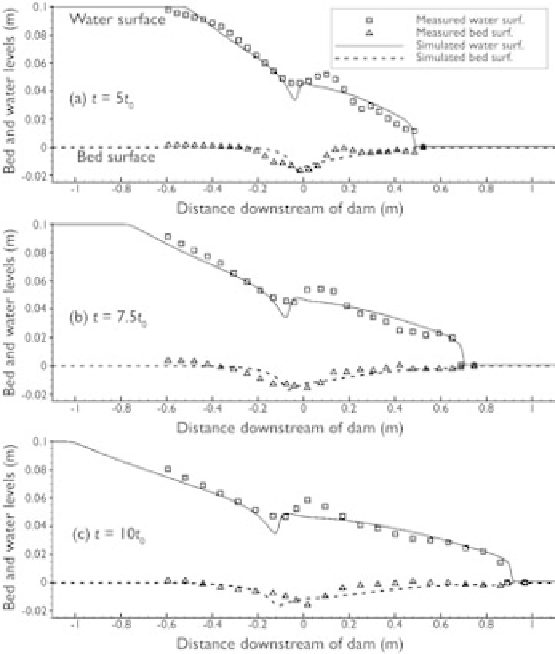
much better. The water and bed surface profiles at various times in both the Louvain
and Taipei cases simulated using the modified van Rijn formulas are compared with
the measured data in Figs. 9.10 and 9.11. The agreement between simulations and
measurements is fairly good. The erosion magnitudes and wave front locations in
both test cases are predicted well by the numerical model. A hydraulic jump in the
water surface forms around the initial dam site in both test cases. Its location is pre-
dicted reasonably well in the Louvain case, where both simulation and measurement
show that the hydraulic jump propagates upstream. However, the location of the
hydraulic jump in the Taipei case is predicted less accurately. The hydraulic jump
moves upstream in the simulation, but this movement was not clearly observed in the
Taipei experiment.
Sensitivities of the simulation results to model parameters, such as the suspended-
load adaptation coefficient
0
, bed-load adaptation length
L
b
, Manning
n
, and
correction factor
k
t
, were analyzed (Wu and Wang, 2007). When each parameter
was considered, only it was adjusted, and all other parameters were given the same
values as used in the model testing just described above. Fig. 9.12 shows how the
simulation results respond to adjustment of each parameter for the Taipei case. As
α
α
0
Figure 9.11
Bed and water surface profiles in Louvain case (Wu and Wang, 2007).