Geoscience Reference
In-Depth Information
used two total-load transport models similar to the decoupled model introduced in
Section 7.3, whereas Wu and Wenka used only the bed-load model component. The
computational meshes used by Wu and Wenka (1998) and Wu
et al
. (2000a) were
the same and had 121, 22, and 15 grid points in the streamwise, lateral, and vertical
directions, respectively. Fig. 7.5 shows the measured and calculated contours of water
depth at the end of the experiment. The morphological developments in the bend
obtained by the three simulations are in fairly good agreement with the measurement.
The maximum depths calculated byWu andWenka (1998) andWu
et al
. (2000a) were
25.59 and 25.68 cm, respectively, at around 45
◦
, as compared with the measured value
of 27 cm at the section around 55
◦
. Both total-load models predicted that the bed load
was about 80%of the total load, so that the results from the bed-load simulation of Wu
and Wenka are not significantly different from those of the two total-load simulations.
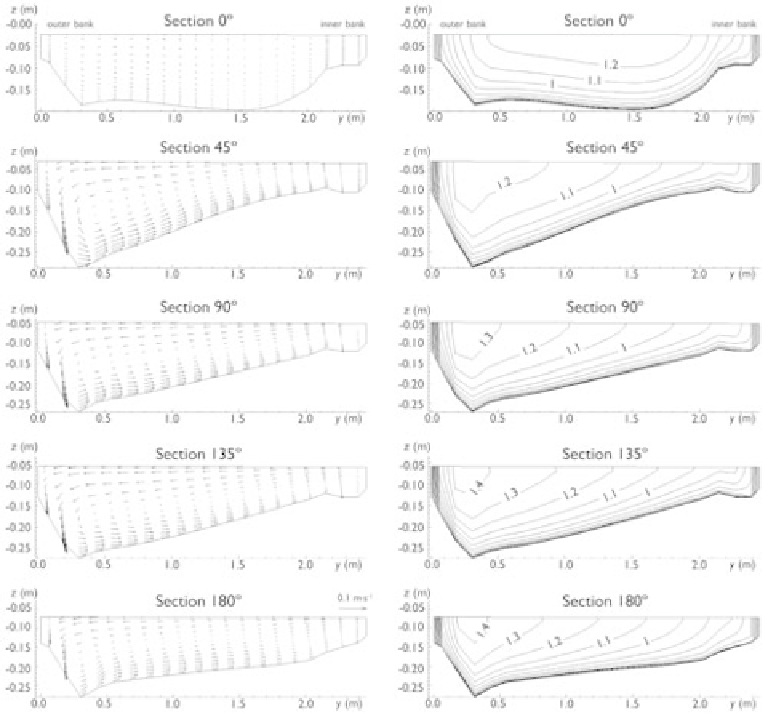
Fig. 7.6 displays the secondary flow velocity vectors and streamwise velocity
contours at various cross-sections through the bend calculated by Wu
et al
. (2000a).
Figure 7.6
Calculated secondary flow velocity vectors and normalized streamwise velocity
U
/
U
in
contours at cross-sections in Odgaard and Bergs' bend (Wu
et al
., 2000a).