Geoscience Reference
In-Depth Information
size of the bed material in the mixing layer. The two parameters in the helical flow
intensity model (6.81) were set as
1.0. The computational mesh
in the bend reach consisted of 91 and 31 points in the longitudinal and transverse
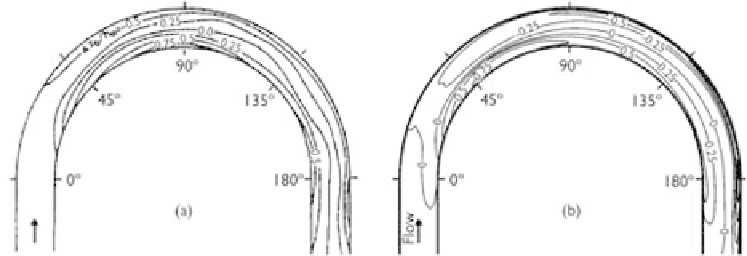
directions, respectively. The time step was 1min. Fig. 6.16 compares the measured
and simulated bed change contours in the bend, and Fig. 6.17 shows the lateral pro-
files of the bed changes at four cross-sections. The general patterns of the deeper
channel along the outer wall and the point bar along the inner wall are reproduced
well by the model. The calculated bed changes are in agreement with the measured
data. Without considering the helical flow effect, one cannot obtain such reasonable
results.
λ
=
3.0 and
β
=
t
s
Figure 6.16
(a) Measured and (b) calculated bed change contours (
z
b
/
h
0
) (Wu and Wang, 2004a).
Figure 6.17
Bed changes at cross-sections in Yen and Lee's (1995) bend (Wu and Wang, 2004a).