Geoscience Reference
In-Depth Information
and 1min in the simulations of Minh Duc
et al
. and Wu, respectively. The Manning
roughness coefficient in the basin was given a value of 0.022 in both simulations.
Fig. 6.5 shows the flow pattern in the basin after 4 hr simulated by Wu. One can
see that two symmetric recirculation eddies appeared. Fig. 6.6 shows the bed elevation
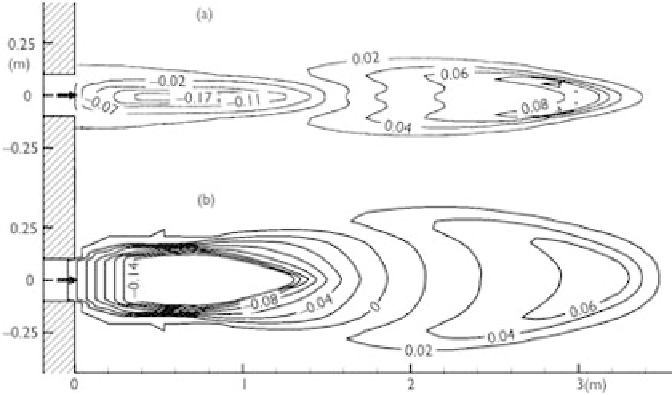
change patterns in the inflow region after 4 hr calculated by two models, and Fig. 6.7
shows the measured and simulated bed elevation changes along the longitudinal cen-
terline. Erosion occurred due to the inflow of clear water, and the eroded sediment
moved downstream and deposited, forming a mound. Wu's simulation predicted faster
erosion and wider deposition than that of Minh Duc
et al
. Both simulated maximum
erosion depths are in fairly good agreement with the measured data.
Figure 6.6
Contours of bed elevation change (m) at 4 hr: (a) simulated by Minh Duc
et al
. (2004) and
(b) simulated by Wu (2004).
Figure 6.7
Measured and simulated bed elevation changes at 4 hr along basin centerline.