Geoscience Reference
In-Depth Information
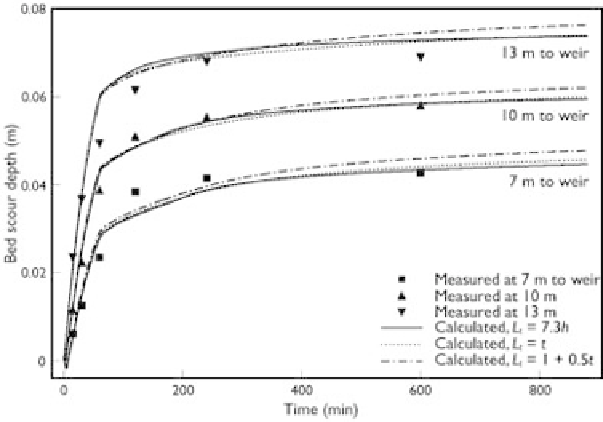
Figure 5.18
Bed scour depths using different adaptation lengths (Ashida and Michiue's Run 6).
L
t
0.5
t
are also very close to the measured data, showing that the
calculated scour depth is not very sensitive to
L
t
.
The influence of the mixing layer thickness on the calculated scour depth was exam-
ined by changing its value from
d
50
to 2
d
50
, while keeping the adaptation length at
7.3
h
. Fig. 5.19 shows that the thicker the mixing layer, the larger the equilibrium scour
=
t
and
L
t
=
1
+
Figure 5.19
Bed scour depths using different mixing layer thicknesses
δ
m
(Ashida and Michiue's Run 6).