Geoscience Reference
In-Depth Information
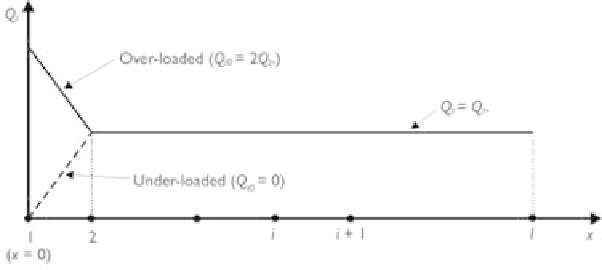
Figure 5.5
Sediment discharge profiles in equilibrium transport model.
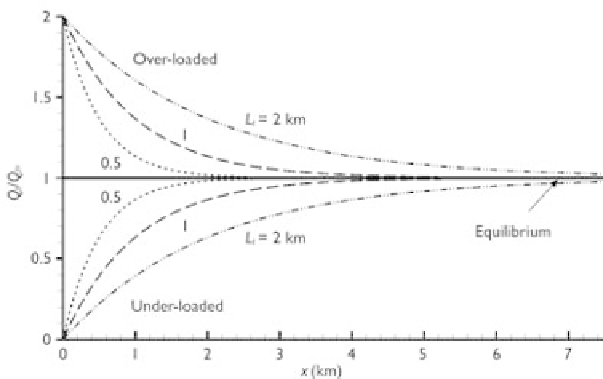
Figure 5.6
Sediment discharge profiles in non-equilibrium transport model.
same cases of erosion (
Q
t
0
2
Q
t
∗
) shown in Fig. 5.5.
The actual sediment discharge does not adjust to the equilibrium one immediately
near the inlet, but after a certain distance downstream. In addition, Fig. 5.6 also
shows that the adaptation length
L
t
is an important parameter in the non-equilibrium
transport model. It essentially determines the sediment discharge profile. At a distance
equal to one adaptation length (
x
=
0 ) and deposition (
Q
t
0
=
0.3679.
A comparison of Figs. 5.5 and 5.6 shows that the non-equilibrium transport model is
physically more realistic and can handle the constrained sediment loading more easily
than the equilibrium transport model. In addition, as
L
t
=
L
t
),
(
Q
t
−
Q
t
∗
)/(
Q
t
0
−
Q
t
∗
)
≈
0, the exchange term in
Eq. (5.34) becomes dominant; thus, Eq. (5.34) reduces to Eq. (5.37) and the sediment
discharge profiles in Fig. 5.6 become those in Fig. 5.5. This implies that the non-
equilibrium transport model is more general and includes the equilibrium transport
model as a special case.
→