Geoscience Reference
In-Depth Information
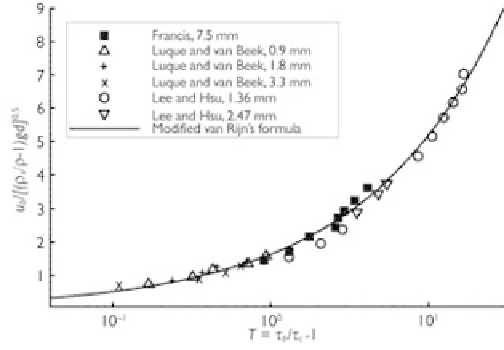
Figure 3.27
Bed-load velocity as function of transport stage parameter (Wu
et al
., 2006).
forms developed. The new curve can be expressed as Eq. (3.136) with 1.64
T
0.5
on the
right-hand side.
Fig. 3.27 and Eq. (3.136) show that the lag between flow and bed-load velocities
increases as sediment size increases.
Lag between flow and bed form development
It has been recognized that a temporal lag exists between flow and bed form devel-
opment, but this lag has rarely been investigated experimentally and numerically.
A simple empirical impulse response model was suggested by Phillips and Sutherland
(1990) to quantify this lag. The interested reader may refer to it. More generally, the
development of bed forms and, in turn, the associated temporal lag can be simulated
using a vertical 2-D or 3-D model if the selected computational mesh is fine enough
(much finer than the lengths and heights of the bed forms simulated). However, this
kind of simulation requires a powerful computer and an advanced numerical model.