Geoscience Reference
In-Depth Information
concentration:
h
σ
s
ω
s
κ
c
c
b
∗
/
z
−
1
U
∗
=
(3.84)
h
/δ
−
1
where
δ
is the reference level near the bed, and
c
b
∗
is the sediment concentration
at
δ
. Eq. (3.84), which was first derived by Rouse (1937),
is called the Rouse
distribution.
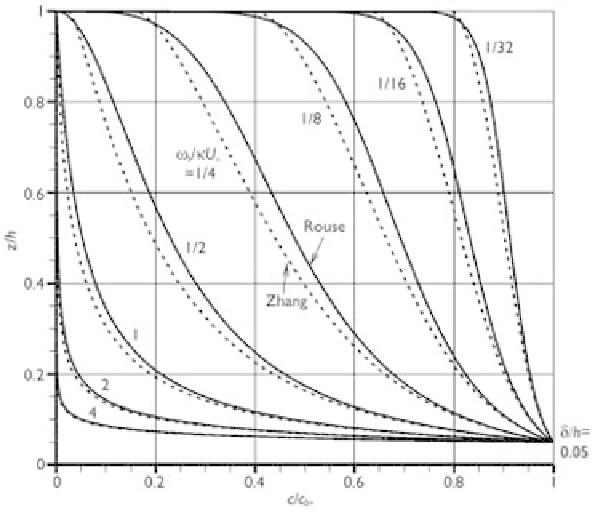
Fig. 3.19 shows the profile of suspended-load concentration calculated using
Eq. (3.84) with
σ
s
=
1. One can see that the calculated concentration is zero at
the water surface and tends to be infinitely large as
z
is close to the bed. These are
not physically reasonable. Therefore, the reference level
is usually set at a certain
height — e.g., 2
d
, 0.05
h
, and half the dune height —above the bed rather than directly
at the bed.
Zhang (1961) derived a distribution function of suspended-load concentration by
using the eddy viscosity determined from the mixing length measured by Nikuradse
in uniform pipe flow:
δ
l
m
h
2
4
=
0.14
−
0.08
η
−
0.06
η
(3.85)
where
l
m
is the mixing length,
h
is the radius of pipe or the flow depth, and
η
=
1
−
z
/
h
.
Figure 3.19
Distribution of suspended-load concentration.