Graphics Reference
In-Depth Information
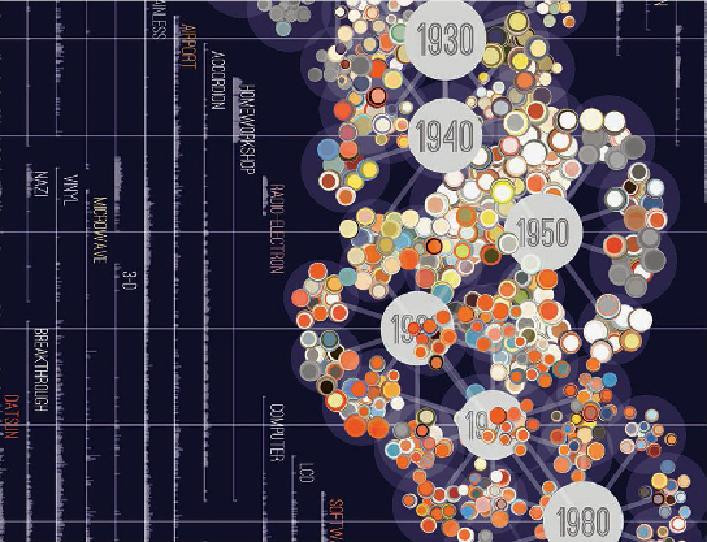
You can see the progression of the design with the elements now resembling what would become
the final outcome. Here the various cultural terms have been added along with more detailed
structure and decade markers. Jer says his working process is 'riddled with dead ends, messy
errors and bad decisions - the 'final' product usually sits on top of a mountain of iterations that
rarely see the light of day.' In this instance there were 134 images that came out of the develop-
ment of this visualization: we have chosen just a few.
Data visualization: Aaron Koblin
Aaron Koblin is creative director of the Data Arts Team at the Google Creative Lab.
His work primarily concerns telling stories with data. He studied with Casey Reas,
the co-creator of the Processing software that he uses to create experiences from data.
He engages the viewer with the information aesthetically and explores the relation-
ships among data sets. Aaron's work takes real-world and community-generated data
and uses it to reflect on cultural trends and the changing relationship between humans
and technology.