Geography Reference
In-Depth Information
continued in major US cities between 1970 and 2000. In absolute terms, the most
dramatic declines were seen in the densest cities (New York, Chicago,
San Francisco) when publicly funded, old and dilapidated housing projects were
demolished. Created after the Wagner Bill of 1937, these large social housing
developments had become pockets of concentrated poverty and uncontrollable
crime. Yet the same large metropolitan areas also benefited from urban renewal
projects which attracted the highest density of new residents back to their centers.
After losing its city center population over a long period of time, the city of New
York finally experienced a rebirth, starting in 1980.
7.2. Big cities
Each city is a specific case, and generalizations quickly reach their limits.
Pennsylvania
Pennsylvania
Connecticut
Connecticut
New Jersey
New Jersey
New York
New York
0
25
50 km
Change in density
inh./km
2
Standard deviation Ellipse of 1970
Standard deviation Ellipse of 2000
-14,500 -
- 500
- 500
-
- 50
- 50
-
0
State
County
0
-
50
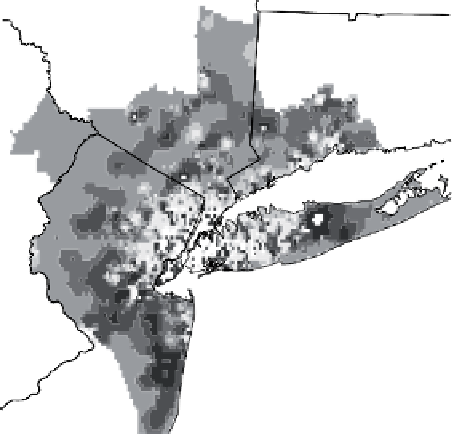
Methodology : Map created by Kernel density smoothing
of the Block Group's
Population. Quartic Function in a bandwidth of the 30
nearest neighbours.
Calculated difference in density 1970 - 2000
50
-
100
100
-
300
300
-
1,000
1,000
- 12,180
Source: US Census bureau
Designed and made by JM Zaninetti, University of Orleans, CEDETE Institute
Figure 7.2.
Urban sprawl around New York, 1970-2000