Geography Reference
In-Depth Information
observed in the South Atlantic, where Florida leads with an annual migration surplus
of 0.8% per year, followed by Georgia and the Carolinas. Most southern states are
attractive to migrants. Outside of the Atlantic coast, Tennessee and Texas lead the
ranks. In the West, the most attractive states to migrants are located inland from the
Pacific coast: Colorado, Arizona, and Nevada. It is in the last state that internal
migrations have had the largest effect, with a net migration surplus of 2.6% per year.
The two states of the Pacific Northwest are also quite attractive to migrants.
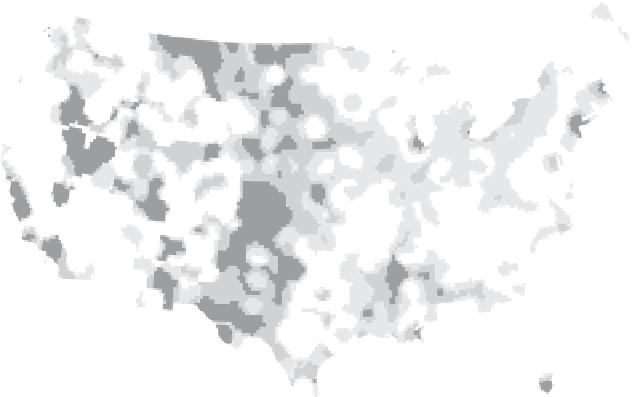
According to 2005 population estimates, recent migration flows have merely
followed previously discussed trends which had already started (see Figure 6.8).
Migration balance
avg. yearly %
1.00 - 5.33
0.50 - 1.00
0.0 - 0.50
- 0.50 - 0.0
-1.0 - -0.50
-3.54
0
50
0 km
Migratory balance
CMSA - MSA
1,200,000
600,000
120,000
-120,000
-600,000
-1,200,000
Method: Quartic Kernel
density smoothing -
Bandwidth: 96 km
- -1.00
Source: US Census Bureau
Designed and made by JM Zaninetti, University of Orleans, CEDETE Institute
Figure 6.8.
Net migration figures for internal population movements, 2000-2005


