Geology Reference
In-Depth Information
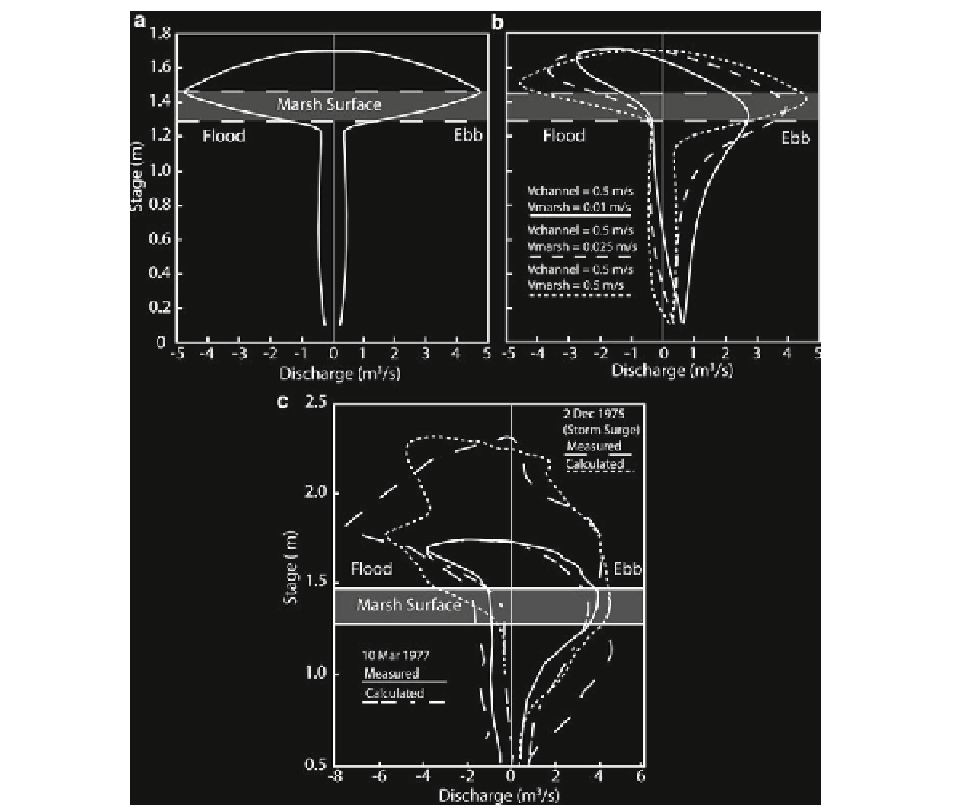
Fig. 11.5
(
a
) The stage-discharge relationship based on the sim-
ple continuity model of Boon (
1975
) ; (
b
) the impact on the asym-
metry of the velocity peaks (as seen in the channel during the fl ood
and ebb) of reducing the velocity (and thus apparent friction)
across the tidal platform relative to that in the channels; and (
c
) the
application of the TIGER model to a real system in Norfolk (UK)
using a channel fl ow of 0.5 m/s and an overmarsh velocity of
0.05 m/s to reproduce the observed stage-discharge relationship
(11.1)
Q
=
S dh
/
dt
or TIGER) to predict the delay in velocity surge dur-
ing the ebb (Fig.
11.5c
). Using this observation in
reverse, a hydrograph from a tidal channel can provide
information about the travel distance and thus, the resi-
dence time of water on the marsh surface (Fagherazzi
et al.
2008
) .
However, this relationship does not fully capture the
asymmetry of the hysteresis loop (Fig.
11.5a
, Fagherazzi
et al.
2008
) . Pethick (
1980
) added an infl uence of
asymmetry from the tidal inlet to this model in order to
address this inconsistency, yet the result still does not
reproduce the relative delay in the peak ebb fl ows.
Fagherazzi et al. (
2008
) demonstrate that the delay in
travel time of water moving across the fl ats contributes
signifi cantly to this behavior (Fig.
11.5b
). Taking this
into account, they successfully use their model (“Tidal
Instantaneous Geomorphologic Elementary Response”
11.4.4 Shear Stress and Erosion Potential
Numerical models of fl ow variation across a marsh
surface demonstrate that shear stress reaches maxi-
mum a value at the tip of channels and near bends