Geology Reference
In-Depth Information
Fig. 10.7
Comparison of particle-size distributions carried out
in situ
on suspended matter by means of a laser particle sizer
(
a
) and in the laboratory by means of a Sedigraph
TM
(
b
). In the
latter case, the analysis was carried out on a disaggregated
(dispersed) sample collected at the same site (Based on Chang
et al.
2007
). It is clearly evident that the bulk of the suspended
material consists of a wide range of differently sized aggregates
which, when disaggregated, is seen to be primarily composed of
constituent particles <10 Pm in size
rapidly with decreasing size, the gradual increase in
mud content in the direction of the energy gradient is
plausibly explained.
The partitioning of mud into two fundamentally dif-
ferent particle groups challenges the conventional wis-
dom of plotting sand/silt/clay ratios in ternary diagrams
and suggests that important information may also be
gained from plotting the ratios of sand, sortable silt
(8-63 Pm fraction), and flocs & aggregates (<8 Pm
fraction). This is illustrated by the two comparative
plots in Fig.
10.9
that were generated from the same
Wadden Sea dataset. While the conventional plot
(a) shows a silt-clay partitioning at proportions of
about 37-63%, the modified plot (b) reveals that, in
this particular example, sortable silt and aggregated
material contribute about equal amounts to the mud
fraction of the back-barrier tidal basin.
The ternary diagrams in Fig.
10.9
show that sedi-
ment composition in back-barrier tidal basins is repre-
sented by narrow bands extending across the entire
spectrum of sedimentary facies from sand to mud as
defined in Fig.
10.6
. Such trends are typical of many
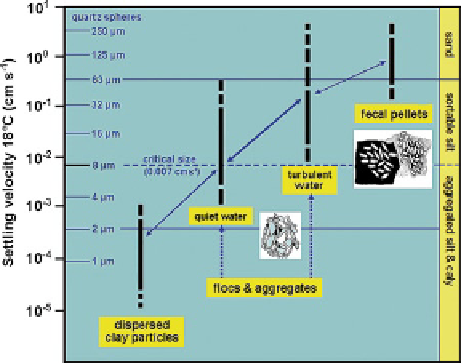
Fig. 10.8
Settling velocities and corresponding grain sizes of
hydraulically equivalent quartz spheres of dispersed clay parti-
cles, flocs and aggregates in quiet and turbulent water, as well as
fecal pellets (Modified after Nichols and Biggs
1985
; based on
data of Migniot
1968
; Haven and Morales-Alamo
1968
; Owen
1971
; and Krone
1972
). Note that the bulk of aggregated mate-
rial exceeds the critical size of 8 Pm. The
arrows
indicate con-
tinuous exchange in the course of aggregation and disaggregation
in response to changes in current shear and bioactivity