Geology Reference
In-Depth Information
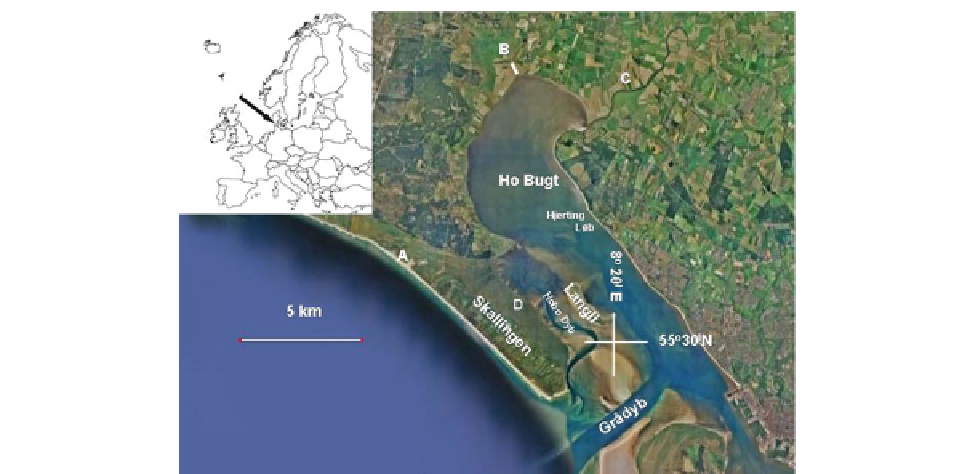
Fig. 8.1
Orthophoto of the northernmost part of the Wadden
Sea located at the eastern part of the North Sea (
arrow
at the
schematic map of Europe,
upper left
). Two generations of barriers
(Skallingen and Langli) divide the northern part of Grådyb tidal
area, Ho Bugt, into two parallel tidal areas, Hobo Dyb and
Hjerting Løb. The mainland to the east consists of glacial deposits
facing the tidal area with an active coastal cliff. The mean tidal
range is 1.6 m but wind tide can raise the water level up to about
4 m above the mean water level. The locations referred to in the
text includes: (
A
) the location of
14
C-dated samples from an old
salt marsh platform emerging on the exposed west coast, (
B
) the
location of an auger cored profi le at Kjelst, (
C
) the Varde Å
Estuary, and (
D
) location of a measuring station in the salt marsh
creek Store Lo at the barrier spit Skallingen
processes in general are very similar to those of salt
marshes. Salt marsh sedimentation and related dynamic
conditions will be evaluated and described with exam-
ples from a wide range of locations. General mecha-
nisms and depositional conditions, however, are
primarily illustrated by examples from the Danish
Wadden Sea based on the author's own experience.
These examples are concentrated in an area belonging
to the northern part of the Grådyb tidal area shown in
Fig.
8.1
. Key locations referred to in the text are marked
with capital letters from A to D.
salt marsh accretion. Later, Yap et al. (
1916
;
1917
) for-
mulated the perhaps fi rst conceptual description of salt
marsh morphodynamics from work in the Dovey
Estuary, UK. They concentrated on interactions
between plants, tidal inundations and creek formation.
Studies on salt marsh formation in North Norfolk, UK,
were initiated in the 1910s-1920s by Oliver (
1913
)
and followed up by Steers (
1936,
1938
) . Similar stud-
ies were carried out parallel with these in the USA
(Chapman
1938
) . The fi rst time series of salt marsh
accretion based on direct measured accretion rates was
published by Richards (
1934
), based on studies from
the Dovey Estuary, followed by Nielsen (
1935
) in the
backbarrier marsh at Skallingen, Denmark. After these
pioneers in salt marsh accretion research, a great many
studies using marker horizons have been published
(e.g. Stevenson et al.
1986
) .
Direct measurements of salt marsh levels represent
another frequently used technique for analysing salt
marsh sedimentation. These types of analysis are either
related to comparisons of maps, surveyed lines of dif-
ferent age, or to point measurements carried out at
more precise time intervals. The latter is similar to the
use of marker horizons, but differs with its relation to
8.2
Measurements of Salt Marsh
Sedimentation Through Time
The fi rst to publish on relations between salt marsh
and tidal levels was Mudge (
1858
) . Later, Shaler
(
1886
) followed with studies on salt marsh formation.
Both recognized the interplay between plants and salt
marsh-forming processes and related peat formation
to vertical zones relative to sea level in the peaty New
England marshes on the north/east coast of USA. Davis
(
1910
) also reported on sea-level change in relation to