Geology Reference
In-Depth Information
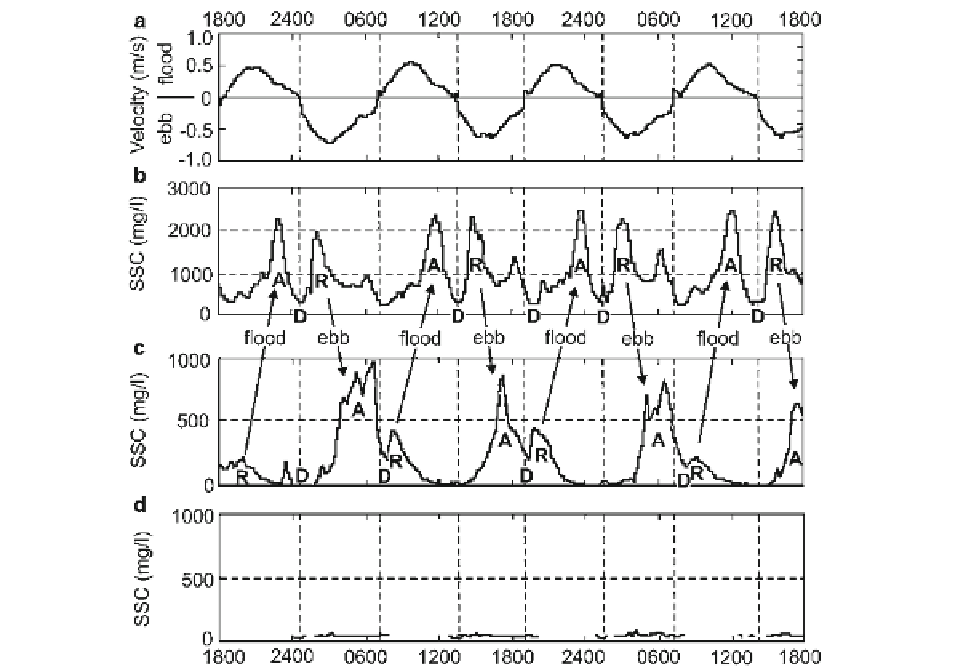
Fig. 5.7
Plots of current speed (
a
) and suspended-sediment
concentration (
SSC
;
b
-
d
) for three locations in a tributary of the
San Francisco Bay estuary, showing the lateral movement
(advection—
a
) of the turbidity maximum in response to the
tides, coupled with deposition (
D
) of the suspended sediment
during slack-water periods and resuspension (
R
) of material
from the bed as the current accelerates after slack water.
Location (
b
) lies at the position of the turbidity maximum at
high tide; location (
c
) lies near the low-tide location of the
turbidity maximum; and location (
d
) lies seaward of the
influence of the turbidity maximum even at low tide. Note the
overall decrease in SSC values from (
b
) to (
d
). The
arrows
between panels (
b
) and (
c
) reflect the advection of the turbidity
maximum: landward during the flooding tide, and seaward dur-
ing the ebbing tide. The excursion distance between the high-
tide and low-tide positions of the turbidity maximum is of the
order of 15 km in this micro-mesotidal system (Modified after
Ganju et al.
2004
, Fig. 3)
tidal water motions and the river discharge (Lesourd
et al.
2003
; Ganju et al.
2004
). The distance that the
water moves during a half tidal cycle is termed the
tidal excursion
(Uncles et al.
2006
) and varies from a
few to many kilometers (Fig.
5.7
). As a result of this
movement, any property of the water that varies longi-
tudinally (e.g. salinity, temperature, SSC, and the con-
centration of any pollutants) will show a variation at
any one location because of the back-and-forth move-
ment of the longitudinal gradient. Thus, salinity is least
at low tide and greatest at high tide. The SSC value
will be greatest at low tide at locations that lie seaward
of the average position of the turbidity maximum, but
will be greatest at high tide in areas landward of the
average turbidity-maximum position. At times of low
river flow, the turbidity maximum is located relatively
far up the river, whereas the turbidity maximum shifts
down river as the discharge increases (Doxaran et al.
2009), perhaps even being expelled from the estuary at
times of highest discharge (Castaing and Allen
1981
;
Lesourd et al.
2003
). A useful parameter for studies of
both the deposition of fine-grained sediment and the
fate of pollutants is the
trapping efficiency
of an estu-
ary, which is related to the 'flushing rate' (Dyer
1995,
1997
; Wolanski et al.
2006
) and estuarine 'capacity'
(O'Connor
1987
), and which is the ratio of the amount
of sediment input by the river to that which accumu-
lates in the estuary. In estuaries with a large water
volume and large, aggrading intertidal areas, the trap-
ping efficiency is high and can even exceed 100% if