Geology Reference
In-Depth Information
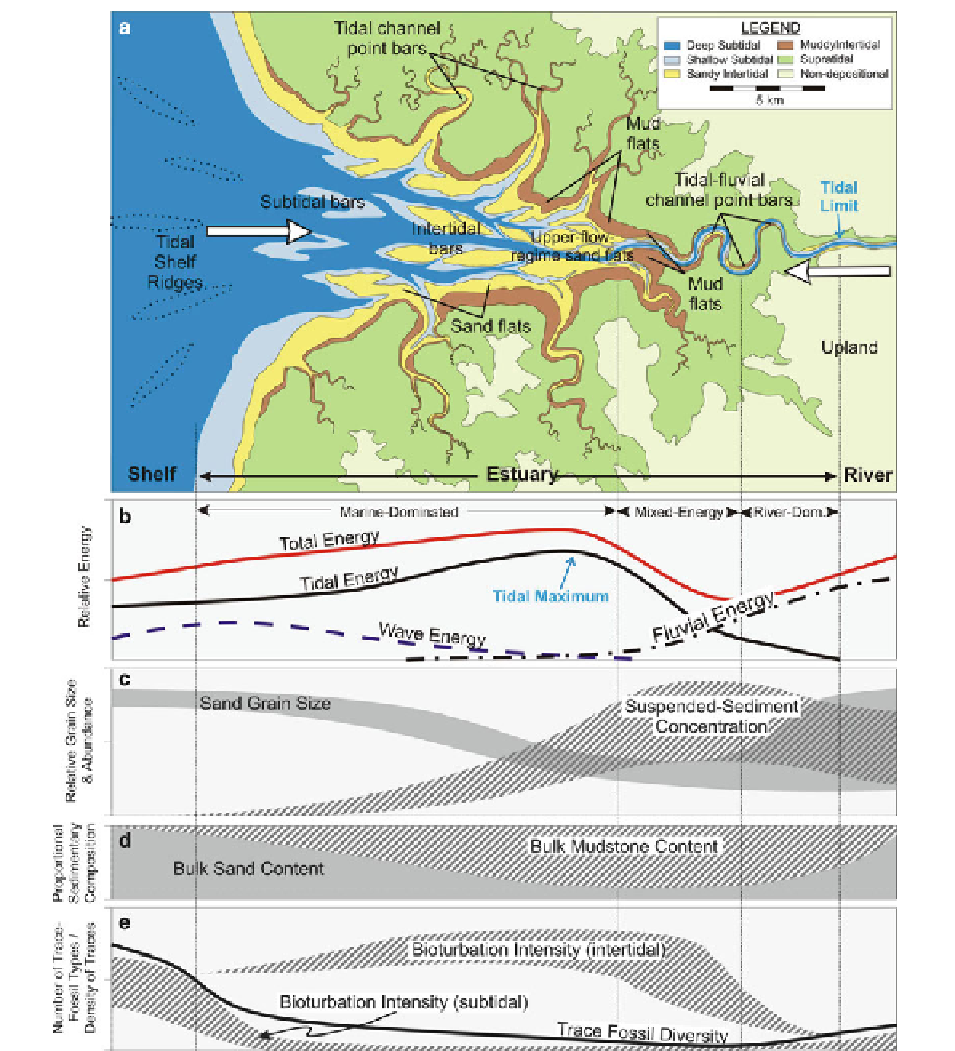
Fig. 5.3
(
a
) Schematic map showing the typical distribution of
channel forms and subenvironments in a sandy macrotidal estu-
ary, based on systems such as the Cobequid Bay-Salmon River
and Bristol Channel-Severn River estuaries. The large
white
arrows
indicate sediment movement into the estuary from both
the landward (fluvial) and seaward directions. (
b
) Longitudinal
distribution of wave, tidal and river energy (Modified after
Dalrymple et al.
1992
and Dalrymple and Choi
2007
). The 'tidal
maximum' is the location where the tidal-current speeds are
greatest. (
c
) Longitudinal distribution of bed-material (sand)
grain size, showing the presence of a grain-size minimum near
the location where flood-tidal and river currents are equal (i.e.,
the bedload convergence), and of suspended-sediment concen-
trations, showing the turbidity maximum. (
d
) Longitudinal dis-
tribution of the relative proportion of sand- and mud-sized
sediment in the deposits. (
e
) Longitudinal distribution of trace-
fossil characteristics, based on Lettley et al. (
2005
) and
MacEachern et al. (
2005
)