Hardware Reference
In-Depth Information
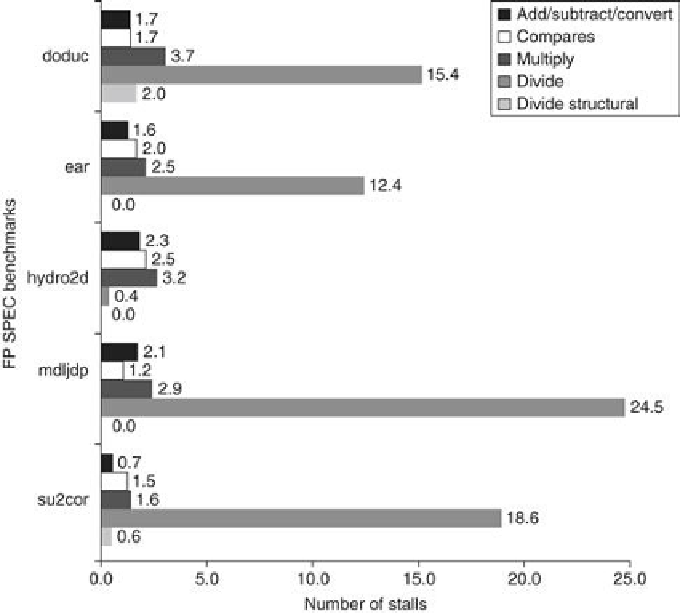
eration on a per-instance basis (i.e., the first bar for each FP benchmark shows the number of
FP result stalls for each FP add, subtract, or convert). As we might expect, the stall cycles per
operation track the latency of the FP operations, varying from 46% to 59% of the latency of the
functional unit.
FIGURE C.39
Stalls per FP operation for each major type of FP operation for the
SPEC89 FP benchmarks
. Except for the divide structural hazards, these data do not depend
on the frequency of an operation, only on its latency and the number of cycles before the res-
ult is used. The number of stalls from RAW hazards roughly tracks the latency of the FP unit.
For example, the average number of stalls per FP add, subtract, or convert is 1.7 cycles, or
56% of the latency (3 cycles). Likewise, the average number of stalls for multiplies and divides
are 2.8 and 14.2, respectively, or 46% and 59% of the corresponding latency. Structural haz-
ards for divides are rare, since the divide frequency is low.
Figure C.40
gives the complete breakdown of integer and FP stalls for five SPECfp bench-
marks. There are four classes of stalls shown: FP result stalls, FP compare stalls, load and
branch delays, and FP structural delays. The compiler tries to schedule both load and FP
delays before it schedules branch delays. The total number of stalls per instruction varies from
0.65 to 1.21.
Search WWH ::

Custom Search