Hardware Reference
In-Depth Information
It indicates what fraction of the memory accesses that leave the processor go all the way to
memory.
Here is a place where the misses per instruction metric shines. Instead of confusion about
local or global miss rates, we just expand memory stalls per instruction to add the impact of a
second-level cache.
Example
Suppose that in 1000 memory references there are 40 misses in the irst-level
cache and 20 misses in the second-level cache. What are the various miss rates?
Assume the miss penalty from the L2 cache to memory is 200 clock cycles, the
hit time of the L2 cache is 10 clock cycles, the hit time of L1 is 1 clock cycle, and
there are 1.5 memory references per instruction. What is the average memory
access time and average stall cycles per instruction? Ignore the impact of writes.
Answer
The miss rate (either local or global) for the first-level cache is 40/1000 or 4%.
The local miss rate for the second-level cache is 20/40 or 50%. The global miss
rate of the second-level cache is 20/1000 or 2%. Then
To see how many misses we get per instruction, we divide 1000 memory ref-
erences by 1.5 memory references per instruction, which yields 667 instructions.
Thus, we need to multiply the misses by 1.5 to get the number of misses per
1000 instructions. We have 40 × 1.5 or 60 L1 misses, and 20 × 1.5 or 30 L2 misses,
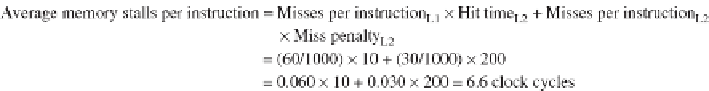
per 1000 instructions. For average memory stalls per instruction, assuming the
misses are distributed uniformly between instructions and data:
If we subtract the L1 hit time from the average memory access time (AMAT)
and then multiply by the average number of memory references per instruction,
we get the same average memory stalls per instruction:

Search WWH ::

Custom Search