Hardware Reference
In-Depth Information
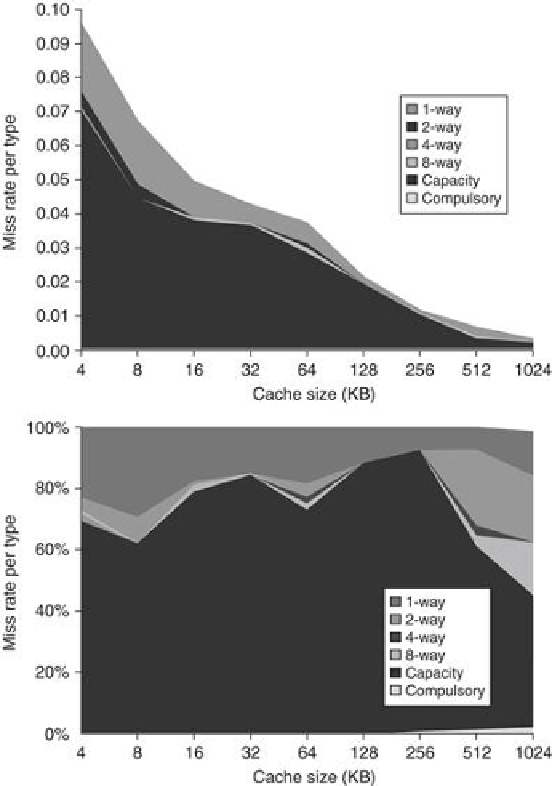
FIGURE B.9
Total miss rate (top) and distribution of miss rate (bottom) for each size
cache according to the three C's for the data in
Figure B.8
.
The top diagram shows the
actual data cache miss rates, while the bottom diagram shows the percentage in each cat-
egory. (Space allows the graphs to show one extra cache size than can fit in
Figure B.8
.)
To show the benefit of associativity, conflict misses are divided into misses caused by each
decrease in associativity. Here are the four divisions of conflict misses and how they are cal-
culated:
■
Eight-way
—Conlict misses due to going from fully associative (no conflicts) to eight-way
associative
■
Four-way
—Conlict misses due to going from eight-way associative to four-way associative
■
Two-way
—Conlict misses due to going from four-way associative to two-way associative
■
One-way
—Conlict misses due to going from two-way associative to one-way associative
(direct mapped)
Search WWH ::

Custom Search