Hardware Reference
In-Depth Information
tectures influence TCO, and how TCO drives operator decisions. This case study will use the
numbers from
Figure 6.13
and
Section 6.4
, and assumes that the described WSC achieves the
operator's target level of performance. TCO is often used to compare different server options
that have multiple dimensions. The exercises in this case study examine how such comparis-
ons are made in the context of WSCs and the complexity involved in making the decisions.
6.1 [5/5/10] <6.2, 6.4> In this chapter, data-level parallelism has been discussed as a way for
WSCs to achieve high performance on large problems. Conceivably, even greater perform-
ance can be obtained by using high-end servers; however, higher performance servers of-
ten come with a nonlinear price increase.
a. [5] <6.4> Assuming servers that are 10% faster at the same utilization, but 20% more
expensive, what is the CAPEX for the WSC?
b. [5] <6.4> If those servers also use 15% more power, what is the OPEX?
c. [10] <6.2, 6.4> Given the speed improvement and power increase, what must the cost
of the new servers be to be comparable to the original cluster? (
Hint
: Based on this
TCO model, you may have to change the critical load of the facility.)
6.2 [5/10] <6.4, 6.8> To achieve a lower OPEX, one appealing alternative is to use low-power
versions of servers to reduce the total electricity required to run the servers; however, sim-
ilar to high-end servers, low-power versions of high-end components also have nonlinear
trade-ofs.
a. [5] <6.4, 6.8> If low-power server options offered 15% lower power at the same per-
formance but are 20% more expensive, are they a good trade-of?
b. [10] <6.4, 6.8> At what cost do the servers become comparable to the original cluster?
What if the price of electricity doubles?
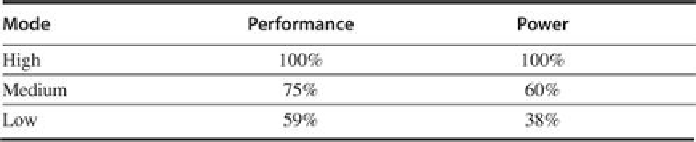
6.3 [5/10/15] <6.4, 6.6> Servers that have different operating modes offer opportunities for dy-
namically running different configurations in the cluster to match workload usage. Use the
data in
Figure 6.23
for the power/performance modes for a given low-power server.
a. [5] <6.4, 6.6> If a server operator decided to save power costs by running all servers at
medium performance, how many servers would be needed to achieve the same level
of performance?
b. [10] <6.4, 6.6> What are the CAPEX and OPEX of such a coniguration?
c. [15] <6.4, 6.6> If there was an alternative to purchase a server that is 20% cheaper but
slower and uses less power, find the performance-power curve that provides a TCO
comparable to the baseline server.
FIGURE 6.23
Power-performance modes for low-power servers
.
Search WWH ::

Custom Search