Hardware Reference
In-Depth Information
and even in those cases the system-wide savings were very small. The complex management
control loop needed to deploy it therefore could not be justiied.
One of the keys to achieving the PUE of 1.23 was to put measurement devices (called
current
transformers
) in all circuits throughout the containers and elsewhere in the WSC to measure
the actual power usage. These measurements allowed Google to tune the design of the WSC
over time.
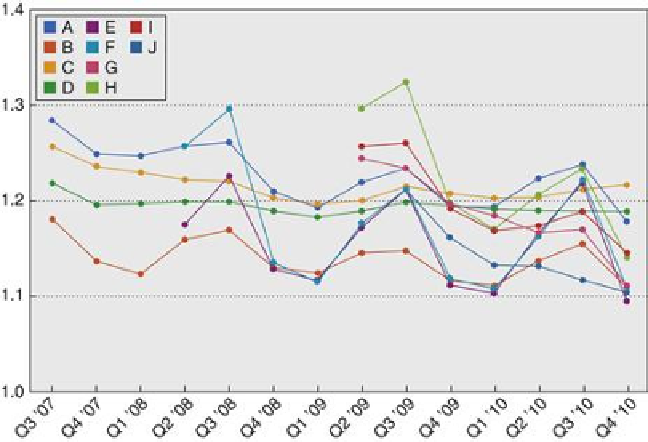
Google publishes the PUE of its WSCs each quarter.
Figure 6.22
plots the PUE for 10 Google
WSCs from the third quarter in 2007 to the second quarter in 2010; this section describes
the WSC labeled Google A. Google E operates with a PUE of 1.16 with cooling being only
0.105, due to the higher operational temperatures and chiller cutouts. Power distribution is
just 0.039, due to the distributed UPS and single voltage power supply. The best WSC result
was 1.12, with Google A at 1.23. In April 2009, the trailing 12-month average weighted by us-
age across all datacenters was 1.19.
FIGURE 6.22
Power usage effectiveness (PUE) of 10 Google WSCs over time
. Google A
is the WSC described in this section. It is the highest line in Q3 '07 and Q2 '10. (From
www.google.com/corporate/green/datacenters/measuring.htm
.) Facebook recently announced
a new datacenter that should deliver an impressive PUE of 1.07 (see
ht-
tp://opencompute.org/
)
. The Prineville Oregon Facility has no air conditioning and no chilled
water. It relies strictly on outside air, which is brought in one side of the building, filtered,
cooled via misters, pumped across the IT equipment, and then sent out the building by ex-
haust fans. In addition, the servers use a custom power supply that allows the power distribu-
tion system to skip one of the voltage conversion steps in
Figure 6.9
.
Search WWH ::

Custom Search