Hardware Reference
In-Depth Information
amount of work performed.
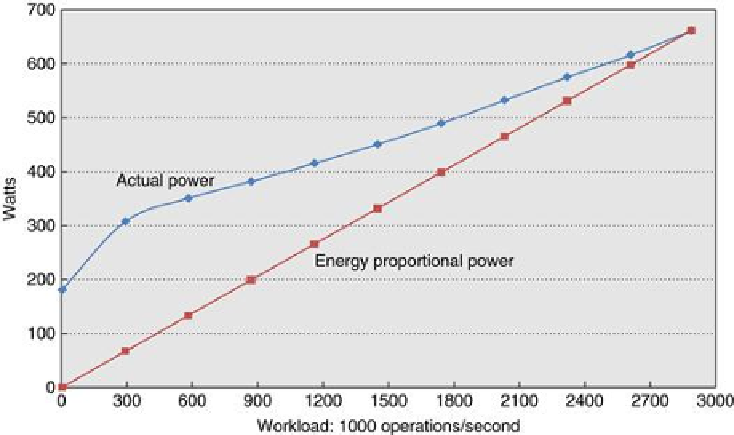
Figure 6.18
shows how far we are from achieving that ideal goal
using SPECpower, a server benchmark that measures energy used at different performance
levels (
Chapter 1
). The energy proportional line is added to the actual power usage of the most
efficient server for SPECpower as of July 2010. Most servers will not be that efficient; it was up
to 2.5 times beter than other systems benchmarked that year, and late in a benchmark com-
petition systems are often configured in ways to win the benchmark that are not typical of sys-
times in the field. For example, the best-rated SPECpower servers use solid-state disks whose
capacity is smaller than main memory! Even so, this very efficient system still uses almost 30%
of the full power when idle and almost 50% of full power at just 10% load. Thus, energy pro-
portionality remains a lofty goal instead of a proud achievement.
FIGURE 6.18
The best SPECpower results as of July 2010 versus the ideal energy pro-
portional behavior
. The system was the HP ProLiant SL2x170z G6, which uses a cluster of
four dual-socket Intel Xeon L5640s with each socket having six cores running at 2.27 GHz.
The system had 64 GB of DRAM and a tiny 60 GB SSD for secondary storage. (The fact that
main memory is larger than disk capacity suggests that this system was tailored to this bench-
mark.) The software used was IBM Java Virtual Machine version 9 and Windows Server 2008,
Enterprise Edition.
Systems software is designed to use all of an available resource if it potentially improves
performance, without concern for the energy implications. For example, operating systems
use all of memory for program data or for file caches, despite the fact that much of the data
will likely never be used. Software architects need to consider energy as well as performance
in future designs [
Carter and Rajamani 2010
].

Search WWH ::

Custom Search