Hardware Reference
In-Depth Information
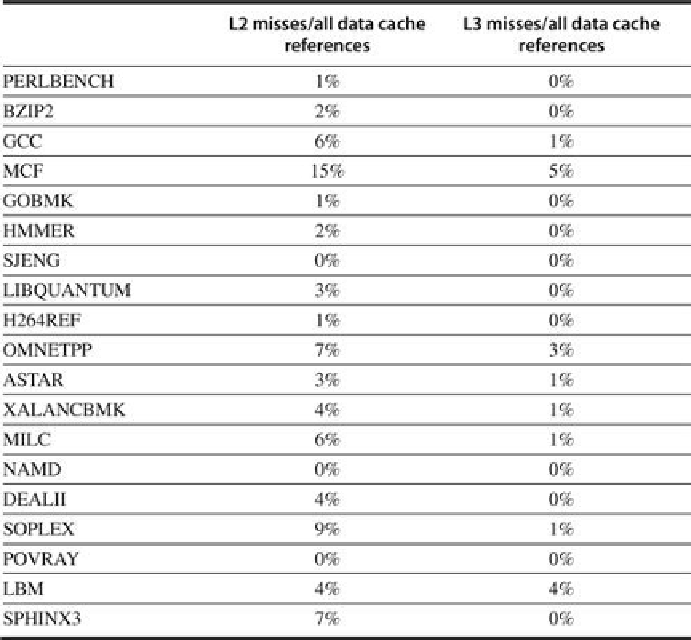
FIGURE 2.25
The L2 and L3 miss rates shown in table form versus the number of data
requests
.
2.7 Fallacies and Pitfalls
As the most naturally quantitative of the computer architecture disciplines, memory hierarchy
would seem to be less vulnerable to fallacies and pitfalls. Yet we were limited here not by lack
of warnings, but by lack of space!
Fallacy Predicting Cache Performance Of One Program From Another
Figure 2.26
shows the instruction miss rates and data miss rates for three programs from the
SPEC2000 benchmark suite as cache size varies. Depending on the program, the data misses
per thousand instructions for a 4096 KB cache are 9, 2, or 90, and the instruction misses per
thousand instructions for a 4 KB cache are 55, 19, or 0.0004. Commercial programs such as
databases will have significant miss rates even in large second-level caches, which is generally
not the case for the SPEC programs. Clearly, generalizing cache performance from one pro-
gram to another is unwise. As
Figure 2.24
reminds us, there is a great deal of variation, and
Search WWH ::

Custom Search