Image Processing Reference
In-Depth Information
The simulation of the echo-traces produced by the reflector was made by integrating a real
echographic signal with a synthetic noise-component similar to the grain reflections
registered in some industrial inspections, and that are quite difficult to be cleaned. The
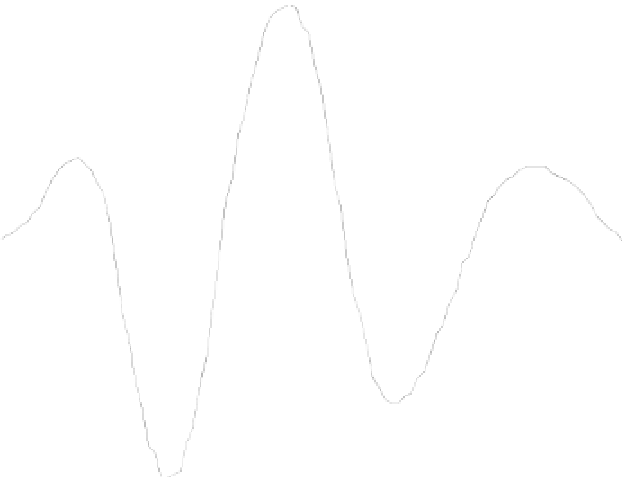
echographic echo was acquired from one of the 4 MHz transducers of the perpendicular
array used for experiments type-II. The sampling frequency was 128 MHz. The echo is
shown in figure 5. The “coherent” grain noise, to be associated with the basic echo-signal,
was obtained by means of a synthetic white gaussian noise generator. To assure the
frequency coherence with the main reflector echo-pulse (simulating an unfavourable case),
this initial noise register was passed thought a digital filter just having a frequency response
as the ultrasonic echo-pulse spectrum. Finally, the composed traces containing noisy echoes
are obtained by the addition of the real echo-signals with the synthetic noise register.
Previously, the noise had been unit power normalized and the echo-signal had been
multiplied by a constant with the finality of obtaining the desired
SNR
ini
.
1
0.8
0.6
0.
0.2
0
-0.2
-0.
-0.6
-0.8
-1
µsec
0
0.1
0.2
0.3
0.
0.5
0.6
0.7
Fig. 5. Ultrasonic echo utilised in type-I experiments.
Several sets of tests were prepared with 11 different
SNR
ini
(0, 1, 2, 3, 4, 5, 6, 7, 8, 9 and 10 dB).
For each
SNR
ini
, 10.000 tests
were performed using the three combination methods described
in section 3, and their respective results were compared. The length of the each individual
ultrasonic trace was of 2304 points (corresponding to 18 microseconds with a sampling
frequency of 128 MHz). 18 microseconds is the time of flight of 48 (24 +24) mm with a
propagation velocity of 2670 m/s, very close to the total echo length from the methacrylate
piece considered in experiments. The length of the echo-signals contained in these traces was
of 98 samples. The size of the final 2D representation is 2304x2304 (5308416) points
(corresponding with an inspected area of 24x24 mm). Thus, from 18432 initial points (2304 by
transducer), a 2D display with 5308416 points was obtained for the whole piece. To measure
the different SNR's, the echo-signal power was measured over its associated area 98x98 points
in the 2D display, whereas for the noise power, the rest of the 2D display points were used.